- TIPS & TRICKS/
- Build Your First Project Plan in Microsoft Project: Tasks, Dependencies and Milestones/
- TIPS & TRICKS/
- Build Your First Project Plan in Microsoft Project: Tasks, Dependencies and Milestones/
Build Your First Project Plan in Microsoft Project: Tasks, Dependencies and Milestones
Most first attempts at Microsoft Project end up as a spreadsheet with a nicer chart. Tasks get typed in, dates get typed next to them, and the moment one thing slips somebody sits there editing forty rows by hand. At that point Project is doing nothing Excel wasn't already doing badly.
The tool's actual job is to work out the dates for you. You describe the work and the order it has to happen in, and Project calculates when everything lands. Change one duration and the whole schedule redraws itself.
This walkthrough builds one real plan from an empty file to a baselined schedule that survives a slip test. The plan is an office move, seventeen rows including phases and milestones. Every date in this article was calculated by Project, not typed by us, and every screenshot is the real application at that exact step. Follow along and your screen should match ours row for row.
What you'll need
Microsoft Project desktop: Project Standard, Project Professional, or a Project Plan 3 or 5 subscription. Project for the web handles a simpler subset and has no Format tab, no baselines and no scheduling-mode control, so it cannot follow this walkthrough.
A real piece of work to plan. An office move, a system rollout, an audit, anything with more than about ten steps and a deadline that matters. Practising on a made-up plan teaches you the buttons but not the judgement.
About 40 minutes.
1. Check the setting that decides whether Project works at all
Before typing a single task, look at the bottom-left of the status bar. On a new file it very often reads New Tasks: Manually Scheduled.
Manually Scheduled means Project will hold whatever dates you type and refuse to move them when the plan changes. It is there for early sketching, when you genuinely do not know the shape of the work yet. Leave it on and you have bought a very expensive spreadsheet.
Click that status bar text and switch it to Auto Scheduled. Everything from here on assumes auto scheduling.
If your dates ever stop responding when you change a duration, this setting is the first thing to check. A single manually scheduled row in the middle of an otherwise healthy plan will quietly refuse to move and drag your credibility with it.
2. Set the project start date
Go to the Project tab and click Project Information. Set the start date and leave everything else alone. Our move starts Monday 5 October 2026.
Two things in this dialog matter more than they look. Schedule from: Project Start Date means Project works forwards from your start, which is what you want almost always. The alternative works backwards from a fixed finish and is for the rare case where the deadline is immovable and you need to know when to begin.
Calendar: Standard is Monday to Friday, eight hours a day, with no public holidays defined. That is worth knowing before you promise anyone a date. If your organisation shuts down at Christmas, Project does not know that until you tell it under Project, Change Working Time.
3. Type the task names, and nothing else
In Gantt Chart view, type the fourteen tasks straight down the Task Name column. No dates, no durations, nothing else yet.
Every row shows 1 day? and the same start date, and every bar sits in the same place on the chart. That is correct. Project has no information yet beyond the names, so it has assumed a one-day estimate for each and started them all on day one.
Resist the urge to type start and finish dates. Every date you type by hand becomes a constraint, and constraints are the single most common reason a plan stops rescheduling itself. The dates are the output of this process, not the input.
4. Add durations: how long, not when
Now fill in the Duration column. Project accepts 3d for three days, 2w for two weeks, 4h for four hours.
Three details in that screenshot are worth pausing on.
The question mark is deliberate. Task 1 reads 3 days? because we typed 3d?. The question mark is Project's own estimated-duration flag, and it is genuinely useful: filter on it later and you get a list of every number in the plan that was a guess. Most people delete the question marks without ever learning what they were for.
The zero-day tasks are milestones. Plan approved, Furniture delivered and Office open are all 0d, and Project has already drawn them as diamonds rather than bars.
The bars still all start on the same day. Durations tell Project how long work takes, not when it happens. Nothing is sequenced until we link it in step 6.
One more thing that catches people out: durations are working time, not calendar time. A five-day task starting on Thursday finishes the following Wednesday, because Project does not schedule work across the weekend.
5. Group the work into phases
A flat list of forty tasks is unreadable. Insert a row above each group, type a phase name, then select the tasks beneath it and indent them with the green arrow on the Task tab, or Alt + Shift + Right arrow.
The three phase rows are now bold, with black bracket-shaped summary bars in the chart. Their durations are calculated from the tasks inside them.
Never type a duration onto a summary row. It is a calculated field. Overwriting it breaks the roll-up and produces a plan that lies to you about how long a phase takes.
6. Link the tasks, which is where a list becomes a plan
Dependencies are the whole point of the tool. The quickest way to enter them is to type task ID numbers straight into the Predecessors column.
Typing 2 into row 3 creates a Finish-to-Start link: task 3 starts when task 2 finishes. That is the default and it covers most real work. The chart immediately redraws as a staircase with arrows showing what drives what.
There are four relationship types, and in practice you will use the first one almost exclusively.
Finish-to-Start (FS). The wall must be built before it is painted. The normal case.
Start-to-Start (SS). Two tasks kick off together, useful for work running in parallel from a shared trigger.
Finish-to-Finish (FF). Two tasks need to land at the same time, common where testing must finish with the build it is testing.
Start-to-Finish (SF). Rare. If you think you need it, you almost certainly want SS or FF.
Lag goes in the same column. Look at rows 8 and 10 in the screenshot: 7FS+5 days and 9FS+5 days. Those are procurement waits. Furniture is ordered, then five working days pass before it arrives, and nobody is doing any work in between. Lag models waiting properly, which beats the common workaround of inventing a fake task called "wait for delivery".
With the links in, Project has calculated the real schedule: Plan approved lands on 12/10/2026, Furniture delivered on 21/10/2026, and the plan finishes on 05/11/2026. The three phases roll up to 6 days for Discovery, 10 days for Prepare and 8 days for Move and handover, against a total project duration of 24 working days. Not one of those numbers was typed in.
7. Read the milestones
Milestones are checkpoints with no work in them: contract signed, system live, sign-off received. They are the 0d rows from step 4, and Project draws them as diamonds.
All three now sit on dates Project worked out: 12/10, 21/10 and 05/11. A sponsor who will never open a seventeen-row plan will happily read three diamonds and a finish date.
Link your milestones like any other task. An unlinked milestone is decoration: it sits on whatever date it was created on and stays there while the work around it moves, which is worse than not having it at all.
8. Look at the critical path before you show anyone
On the Gantt Chart Format tab, tick Critical Tasks.
The red chain is the sequence that determines the finish date. In our move that is tasks 2, 3, 4, 5, 9, 10, 13, 14, 15, 16 and 17: requirements, floor plan, landlord, cabling, then the whole move weekend and handover run. If any of those slips by a day, 10 November becomes 11 November.
The blue tasks are the interesting part. Order furniture, Furniture delivered and Book the removals firm are not critical, which means they have float: room to slip before they affect anything.
Here is the detail almost every guide gets wrong. That float is not one shared number. The furniture chain, tasks 7 and 8, carries 3 days of total slack. Book the removals firm carries 11 days, because it feeds the move weekend alongside Pack and label, and Pack and label is the driving predecessor. So the removals booking can drift for over two working weeks before it bites, while the furniture order cannot. Read each figure off the Total Slack column rather than assuming one value covers everything that is blue.
This is the single most useful view in the tool. It is the answer to "where do I put my attention this week", and it is why a plan is worth building properly rather than drawing in PowerPoint.
9. Set a baseline, or you will never be able to prove what changed
Go to Project, then Set Baseline. Choose Baseline, leave it on Entire project, and click OK.
A baseline is a snapshot of the plan as promised. Without one, Project only ever shows you the current plan, and the current plan always looks reasonable, because it has quietly absorbed every slip so far. The baseline is what lets you say "we are three days later than we said" instead of "it feels like we are behind".
Set it once the plan is agreed and before work starts. Re-baseline only when the plan is formally changed, never when it slips. A baseline you reset every time reality intrudes measures nothing.
10. The slip test: proof you built a plan and not a picture
This is the test worth running before any plan goes to a sponsor. Take one task in the middle of the plan and make it longer. We changed task 10, Cabling installed, from 4d to 7d. Nothing else was touched.
Then switch to View, Tracking Gantt, so the grey baseline bars sit behind the rescheduled ones.
Three working days added to one task, and the plan responded on its own: Cabling installed now finishes 29/10 instead of 26/10, Pack and label moves to 30/10, the move weekend goes to 03/11, and Office open moves from 05/11/2026 to 10/11/2026. The Finish Variance column reads 3 days, and the grey baseline bars show exactly where every task was supposed to be.
Note that the plan slipped three working days, not three calendar days, and the finish moved by five calendar days because a weekend sits in the middle. This is precisely the arithmetic people get wrong in their heads and in spreadsheets.
If your own plan does that, you have built a schedule. If your dates sit still, something is manually scheduled or a date was typed somewhere, and it is worth finding before a sponsor does.
The four mistakes that cause almost every broken plan
Leaving tasks manually scheduled. The dates hold still and the plan silently stops working. Check the status bar and the Task Mode column.
Typing start or finish dates. Every one creates a constraint, and constraints override the logic you built. If a task will not move, this is usually why.
Typing durations onto summary rows. It breaks the roll-up, and the phase then reports a length that does not match the work inside it.
Never setting a baseline. Without one you can describe a slip but you cannot measure it, and the plan quietly rewrites its own history every time you save.
Learn it properly, with a trainer in the room
Everything above is roughly a day's work with someone on hand to answer "why did that date jump?" at the moment it jumps. That question is where the real learning is, and it is very hard to get from a manual.
Our Microsoft Project Introduction course covers exactly this ground hands-on: scheduling modes, durations and estimates, dependency types and lag, summary structure, milestones, the critical path, baselines and tracking. Project Advanced goes on to resources, costs, levelling, custom fields and reporting across multiple plans.
Both run as scheduled online sessions or in person at your offices anywhere in the UK, and we regularly run them as a closed course for a single team, built around scenarios that mirror the projects your team actually runs. Tell us what you are planning and we will tell you which course fits.
See our Microsoft Project coursesNext available dates
Project Introduction
Live, instructor-led training with a real trainer. Book a seat on a scheduled date below, or get a quote for your team to run it privately.
2 Nov 2026
Monday · Virtual · 1 day
£315per person + VAT
14 Jan 2027
Thursday · Virtual · 1 day
£315per person + VAT
8 Mar 2027
Monday · Virtual · 1 day
£315per person + VAT
Other courses related to this article
Ready to train your team?
Tell us what you need and we'll come back to you with a detailed quote.
- Tailored contentBuilt around your team's work and skill levels.
- Flexible schedulingDates and times that suit your team, not ours.
- Your place or onlineDelivered at your office or virtually.
- Better value per headOne trainer, one day, your whole team.
- A dedicated trainerYour team gets all of the trainer's attention.
- Realistic examplesSample data built around the kind of work your team does.
We reply with available dates and a price for your team. No obligation.
Related Articles
 Tips & Tricks
Can you Calculate Variance Using Excel?
In this guide, we explain variance as a measure of how widely data points deviate from the mean and shows why understanding this spread is useful for deeper insight and risk assessment. It walks readers through calculating variance in Excel, distinguishing between the VAR.S function for a sample and VAR.P for an entire population, then demonstrates each with a car-sales case study.
 Tips & Tricks
How to Use Excel Lookup with Multiple Criteria
This blog explains how Excel’s LOOKUP functions—particularly XLOOKUP and VLOOKUP—can retrieve data based on multiple criteria. It walks through a step-by-step example of finding an employee’s sales in a specific region, showing both an XLOOKUP formula and a VLOOKUP alternative that uses a helper column.
 Tips & Tricks
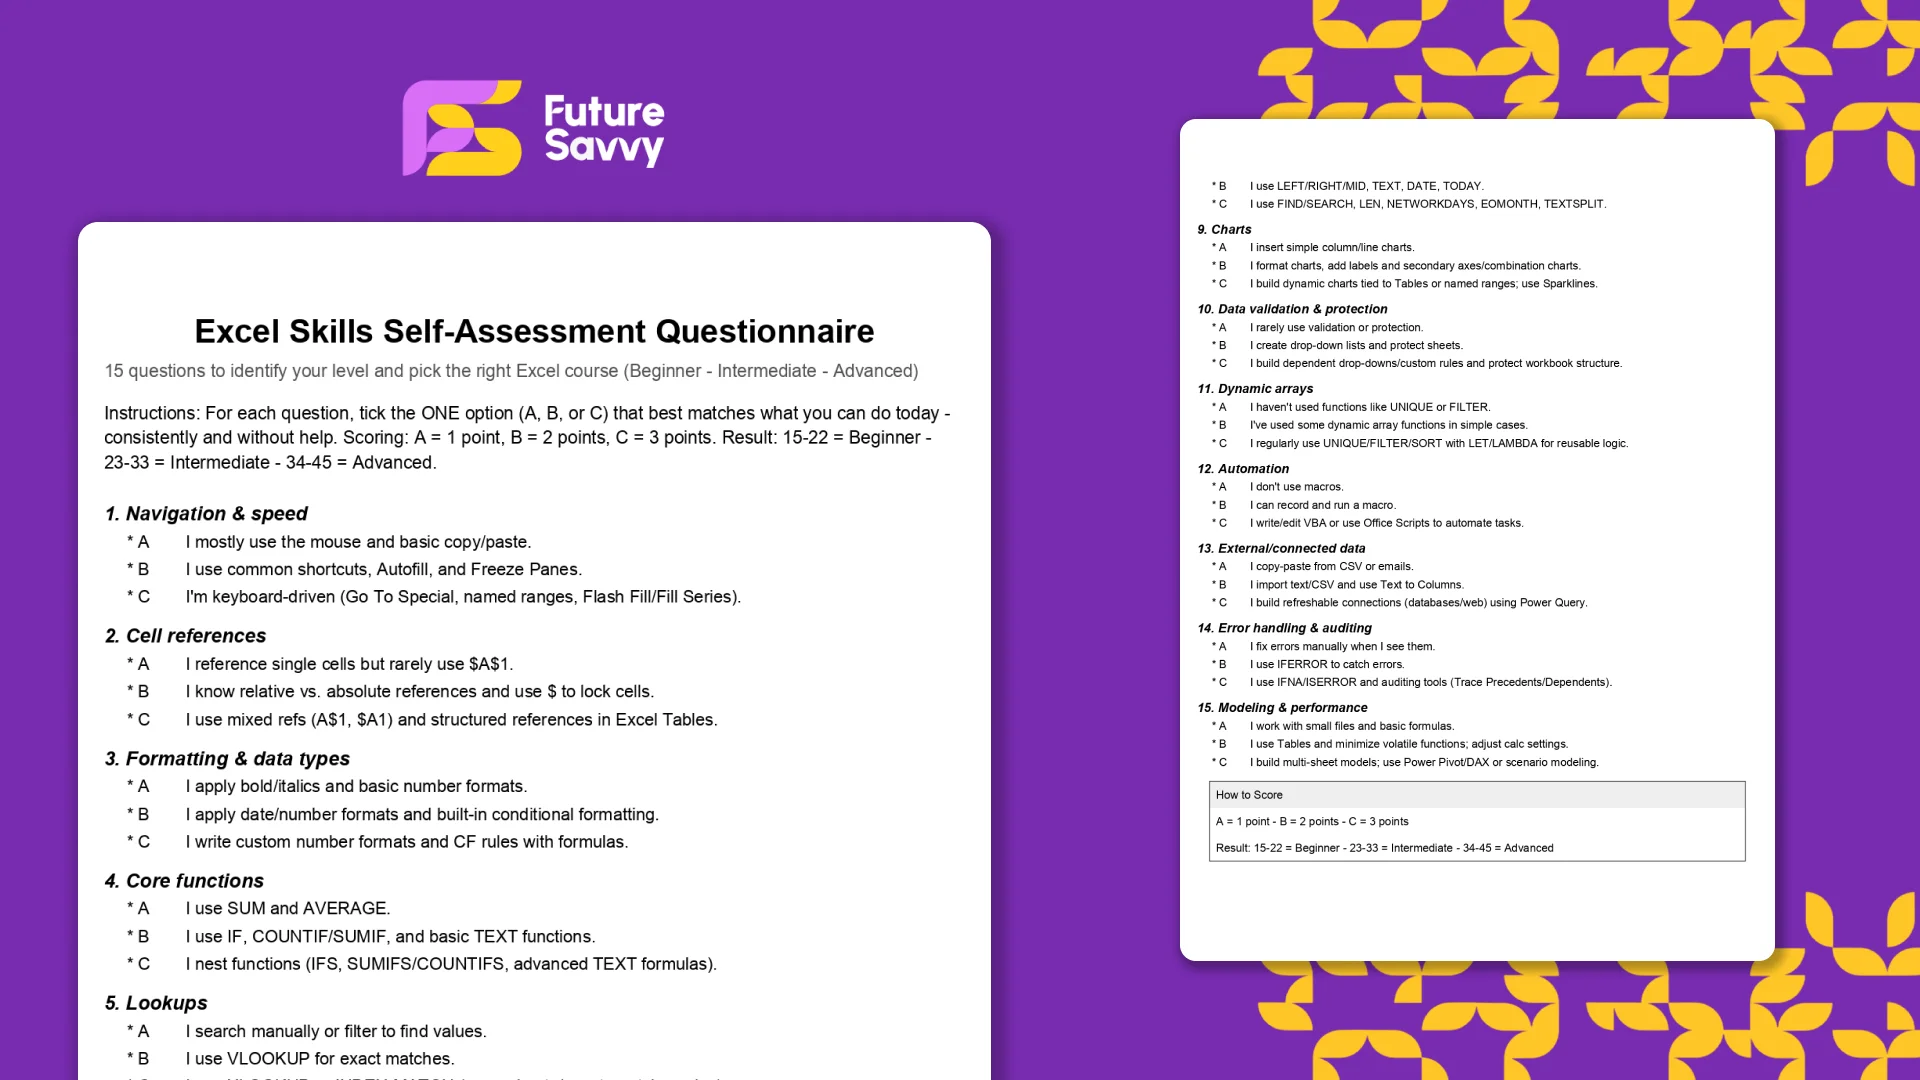
Excel Skills Self-Assessment Questionnaire
This free, printable Excel Skills Self-Assessment helps you quickly gauge your level and pick the right next step in your learning path. It contains 15 multiple-choice questions spanning navigation, formulas, lookups, tables, PivotTables, charts, dynamic arrays, Power Query, and more. You’ll score yourself and interpret the result to see whether you’re Beginner, Intermediate, or Advanced - then follow tailored course recommendations based on your score.
Insights for modern teams
Stay ahead with our latest learning trends, tools, and success stories. Enter your email address below to receive updates from us.