- TIPS & TRICKS/
- Can you Calculate Variance Using Excel?/


Can you Calculate Variance Using Excel?
- TIPS & TRICKS/
- Can you Calculate Variance Using Excel?/
Can you Calculate Variance Using Excel?
Variance is simply a way to measure the spread and dispersion of numbers in a dataset. Specifically, it measures how far from the mean each number in the dataset is. The higher your variance, the more spread out and scattered your data is, while a lower variance means most of the numbers are relatively similar and bunched up around the mean.
Knowing this variance helps you develop a greater understanding of your data, gain knowledge on how different data points relate to one another, and identify potential risks.
One of the best and easiest ways to calculate variance within a dataset is to use Excel, as the process only includes a couple of steps.
This guide has a closer look at how you can calculate variance using Excel, and the benefits these calculations can provide to your business.
Want to take your skills to the next level? Take a look at our other Excel courses.
How to Calculate Variance Using Excel
The process for calculating variance using Excel is relatively straightforward, but the exact method you’ll use depends on whether you’re calculating the variance for a sample, or an entire population.
If you’re calculating the variance for only a sample of an entire population, you’ll use the VAR.S function, which has the syntax =VAR.S(data range). But if you’re calculating the variance for the whole population, you’ll use the VAR.P function, which has the syntax =VAR.P(data range).
For these examples, the “data range” refers to the cells you want to include in the calculation.
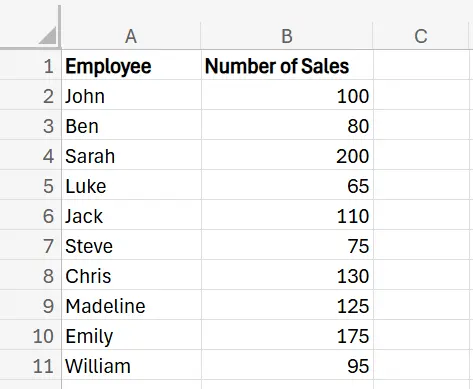
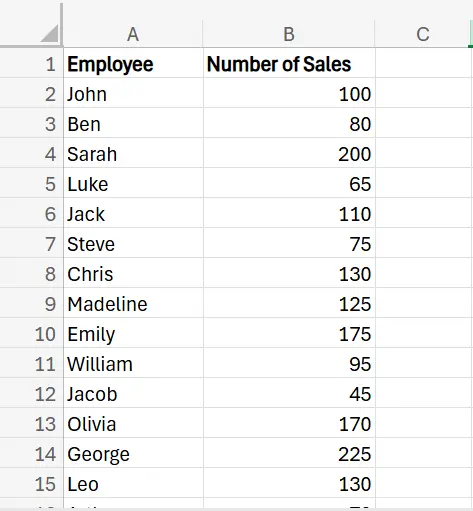
For this guide, we’re using an example of a car dealership that wants to use a variance calculation to monitor the performance of its employees. Specifically, it wants to measure how many cars each of its employees sells in a year. For the sample, the company has a list of 10 employees, while the entire population (all of the salespeople working for the company) is 40 employees.
Here are the instructions for calculating variance using both methods.
Download our Excel Formulas Cheat Sheet
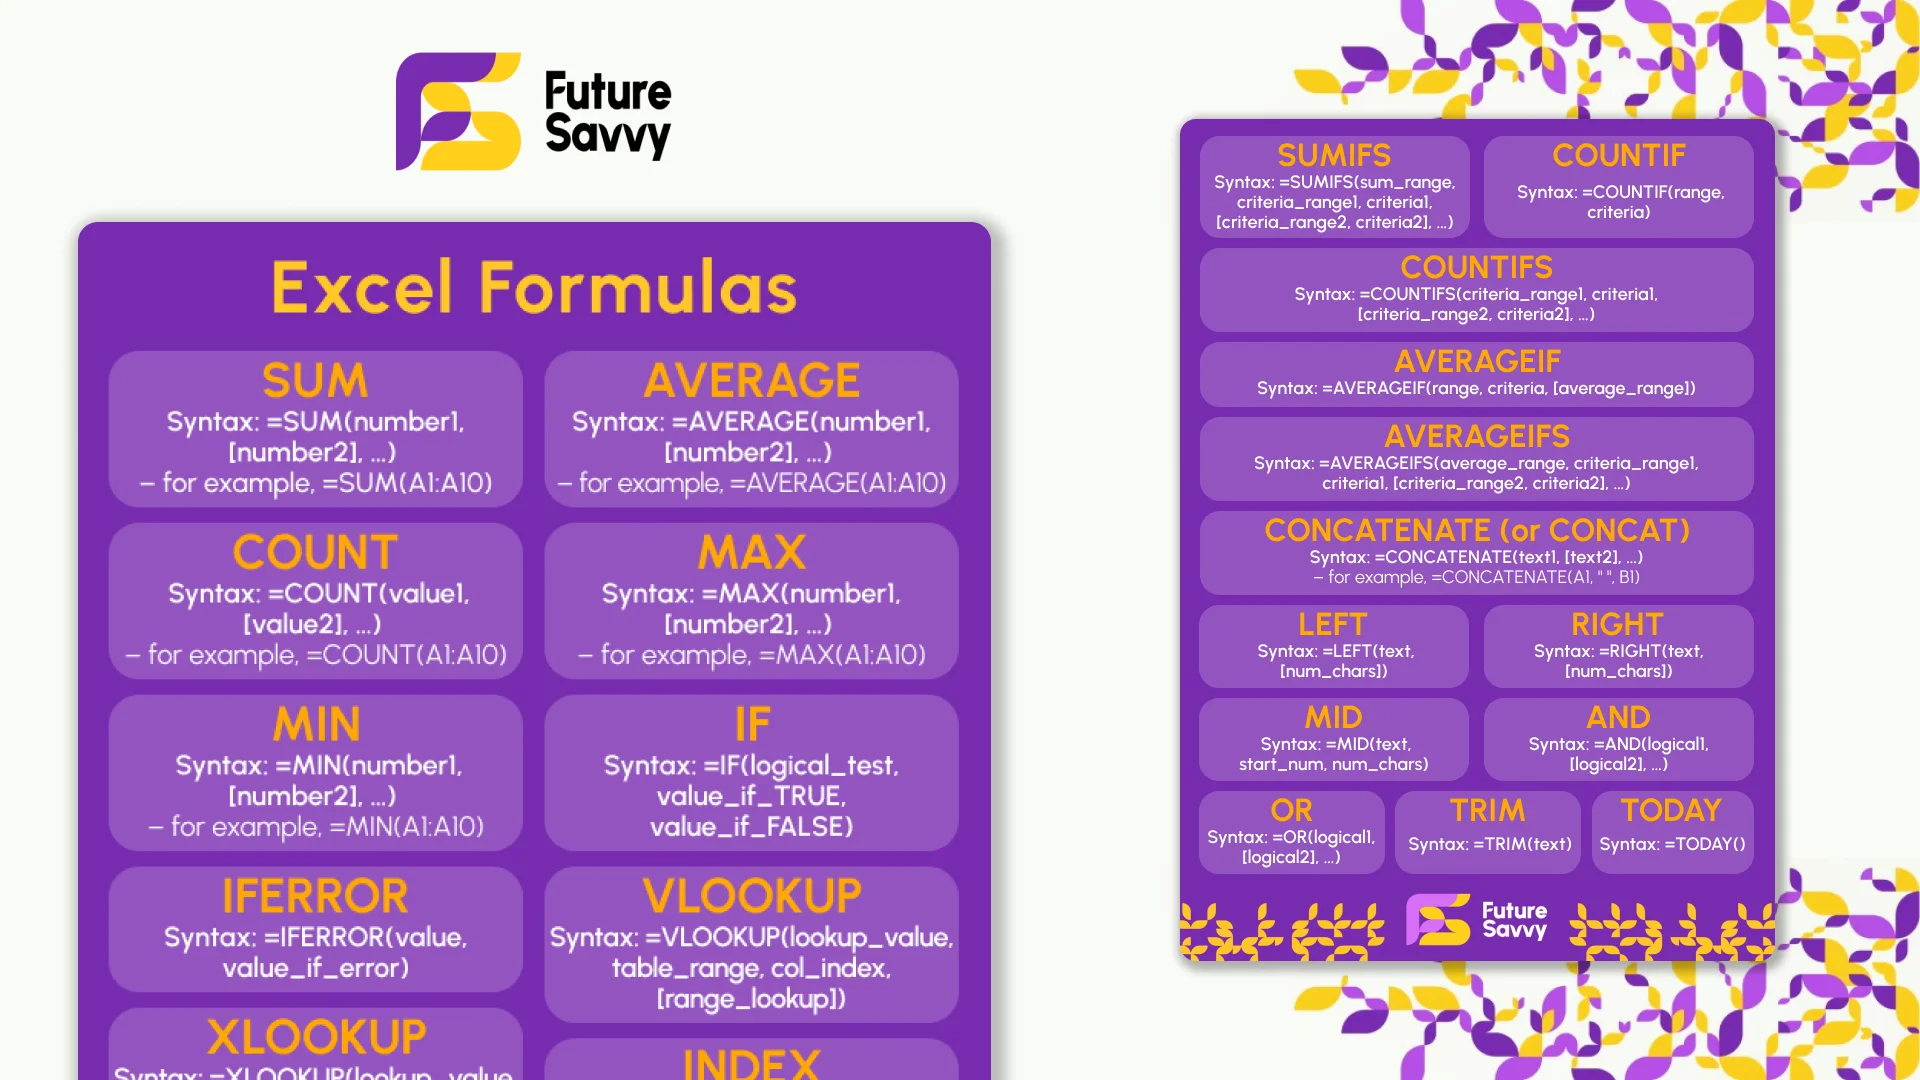 Download now
Calculating the Variance of a Sample
1. Begin by adding your sales data sample into Excel.
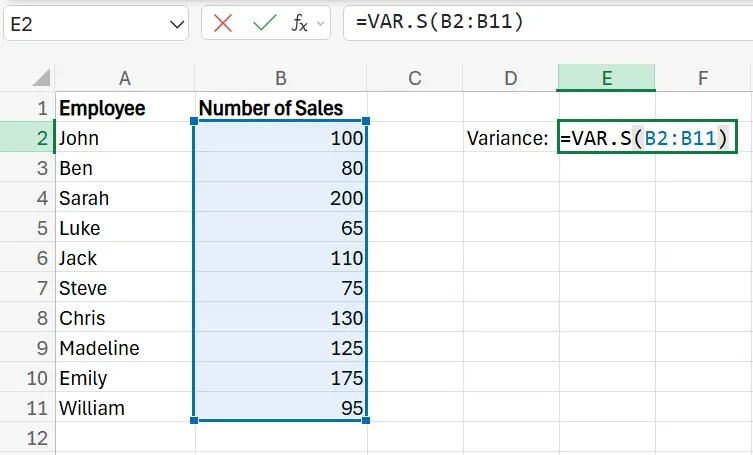
2. Next, in a cell beside the table, add the syntax =VAR.S(data range). For the data range, simply click and drag through the entire column of sales numbers.
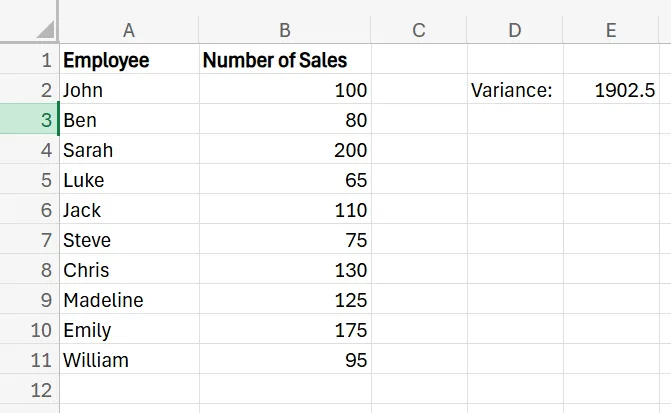
3. After clicking Enter, you’ll be left with the variance for the dataset. A larger number means that data points are spread out, while a smaller number means they’re packed tightly around the mean. In this specific example, a larger variance means that sales numbers are inconsistent from person to person, while a smaller variance means most people are selling around the same number of vehicles annually.
Calculating the Variance of a Population
1. Start by adding the sales data for your entire population into Excel.
2. In a cell beside the table, this time add the syntax =VAR.P(data range).
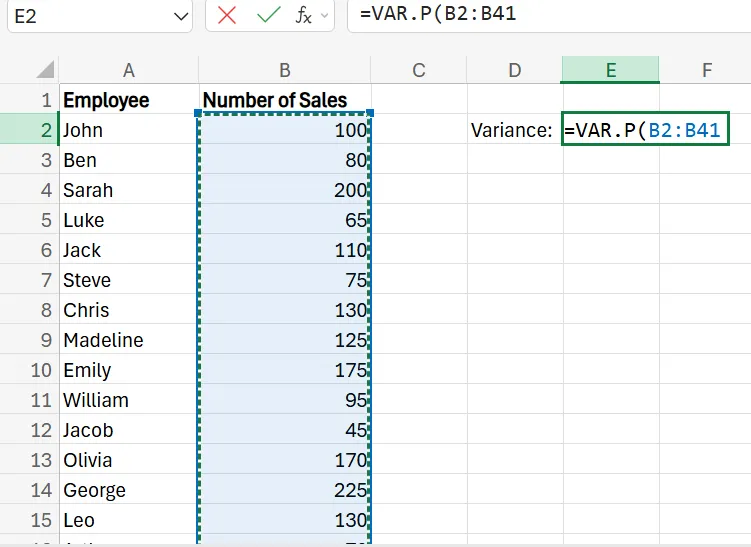
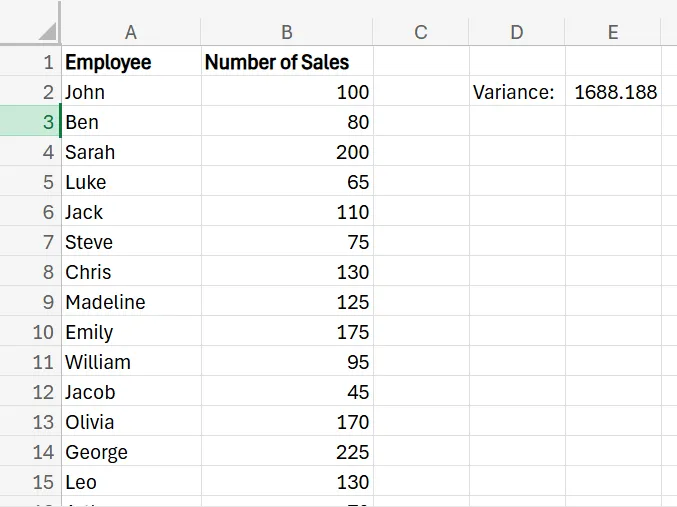
3. After clicking Enter, you’ll be able to see the variance for the entire population of salespeople.
Calculating Standard Deviation
While variance certainly has merit and is important to know in some cases, it doesn’t offer a lot of practical information you can use. If you want to gain more usable insights, consider calculating the standard deviation of this variance value.
To do this, all you need to do is use the square root function in Excel. The process for doing this is simply entering the syntax =SQRT(variance) in a cell.
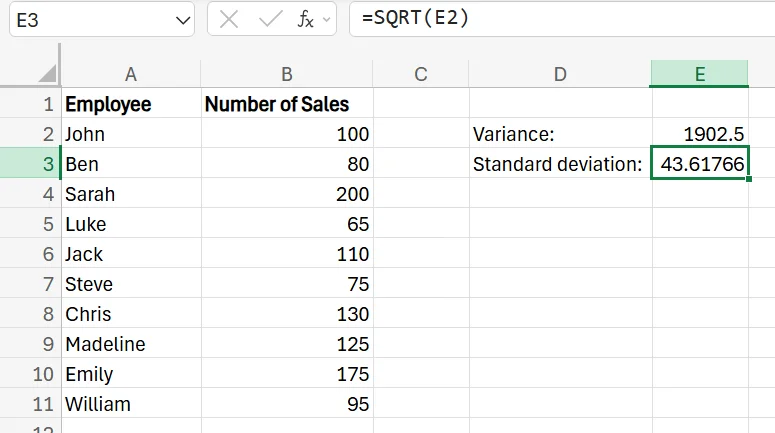
So in the case of the 10-person sample dataset, the standard deviation is just over 43. If you combine this standard deviation with the mean of the sample data set (which is the total number of sales divided by the number of salespeople), you can get a range of the “normal” amount of sales for those in the dataset.
For the above example, the mean sales number is 115.5. Combine this with the standard deviation (which we’ll round up for simplicity's sake), and you can see that most salespeople within this dealership are selling between 71.5 and 159.5 cars annually.
So, anyone below this range may be struggling more than normal, while those above this range are performing above and beyond their peers in terms of sales.
Download our White Paper: The Impact of Skills Underinvestment on UK SMBs
 Download now
Additional Functions to Analyse Your Data
There are also additional functions you can use to gain a more complete and comprehensive look at your data. This includes MIN (identifying the smallest value in a dataset), MAX (identifying the largest value in a dataset), COUNT (identifying the number of rows or items in a dataset), and SUM (the total of all the values in the dataset added up).
The car dealership in our example can use these functions for a variety of things, from seeing sales outliers (both on the high and low end), to counting how many salespeople are in the dataset, and even figuring out the total annual car sales for the entire dealership
Calculating Variance in Excel: Tips and Tricks
In addition to being used to measure employee performance, your company can use variance for a variety of different business applications. It can help in comparing your actual sales figures to projections to see how accurate your forecasting was, can help assess risks, and even monitor your expenses to identify where most of your money is going. This is useful for seeing if you’re overspending anywhere where you shouldn’t be.
You can use it to measure and boost production efficiency, improve your decision-making, improve the quality of your reports, and evaluate investments.
Contact us to learn more about our instructor-led training programs designed to help you and your business!
Frequently Asked Questions (FAQ)
Prompting, verification, workflow design, automation, and responsible AI use.
No. These skills apply across functions, from admin and marketing to finance and operations.
Clear examples of how you used AI to save time, improve quality, or support better decisions.
Begin with your current tasks, test AI on repeat work, and track the results.
Related Articles
 Tips & Tricks
How to Use Excel Lookup with Multiple Criteria
This blog explains how Excel’s LOOKUP functions—particularly XLOOKUP and VLOOKUP—can retrieve data based on multiple criteria. It walks through a step-by-step example of finding an employee’s sales in a specific region, showing both an XLOOKUP formula and a VLOOKUP alternative that uses a helper column.
 Tips & Tricks
How to Calculate Age in Excel
Learn how to calculate age from a date of birth in Excel using the DATEDIF function, plus alternatives like YEARFRAC and INT for greater precision. This step-by-step guide covers cell formatting, formula entry, and quick copying, and explains why age calculations matter for HR planning, customer insights, and resource allocation.
 Tips & Tricks
