Tips & Tricks
Tips & tricks For Microsoft Excel, Power BI, SQL and more
Read a selection of tips & tricks that make using Microsoft Excel, Power BI, SQL and more way easier!
We’ve got loads of handy user guides for Microsoft Excel, Power BI, SQL, SharePoint and more that’ll make your life way easier. Want to learn how to get the best out of your Microsoft 365 and Microsoft Power Platform applications in your organisation? Contact us today about training courses for business.
 Tips & Tricks
Top AI Asset Management Platforms Reviewed
AI asset management patforms are moving into mainstream use as firms face fee pressure, tighter regulation, and the need to scale investment workflows with clear audit trails. The article compares platforms as products - focusing on real-world portfolio construction and rebalancing, transparent risk analytics, scalable personalisation and suitability, integrations, deployment options, economics, and governance.
 Tips & Tricks
AI Invoice Processing: The End of Manual Entry
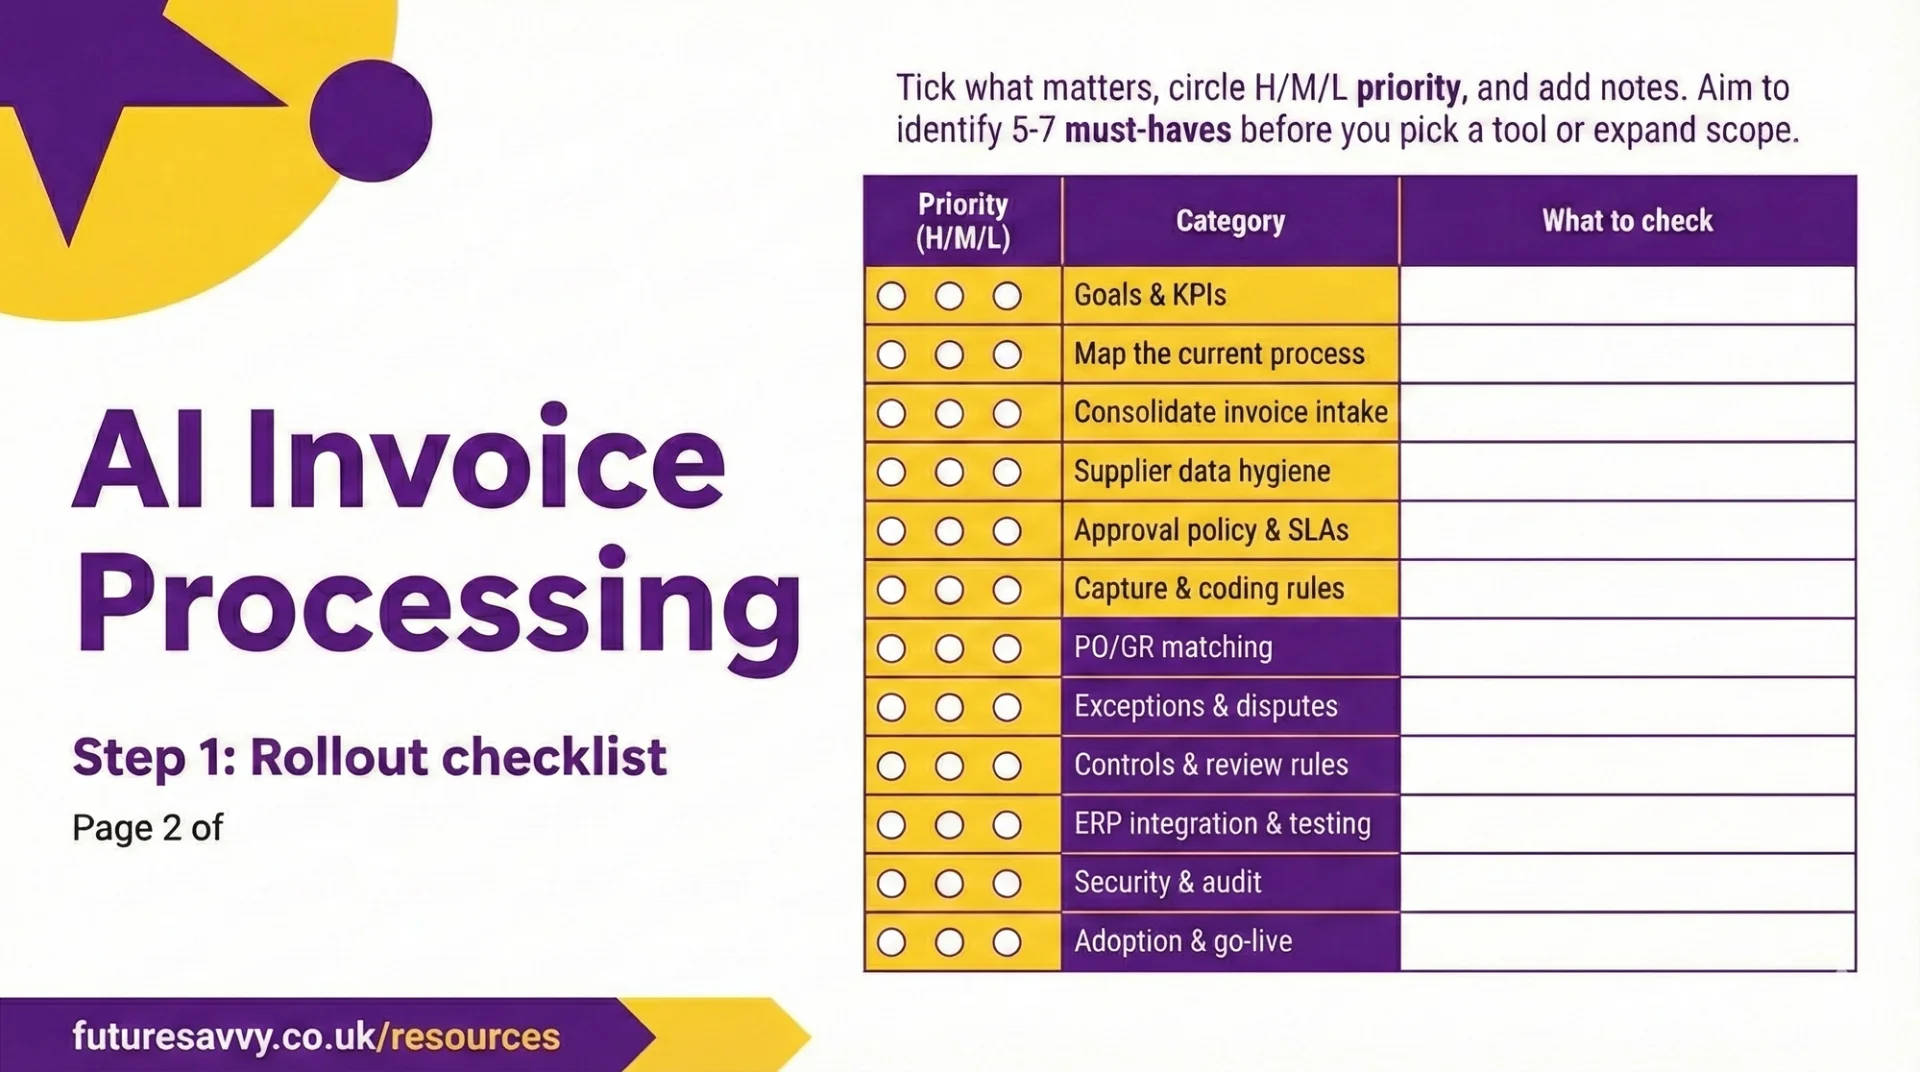
Manual invoice processing is slow, error-prone, and limits visibility into cash going out the door. AI invoice processing automates data capture, PO matching, approval routing, and fraud/duplicate checks so AP teams can focus on exceptions instead of typing and chasing. The article explains how the technology works day-to-day, what features and KPIs matter most, and a practical roadmap to pilot, roll out, and prove ROI quickly.
 Tips & Tricks
 Tips & Tricks
Data Analytics and AI: From Reporting to Predicting
Finance teams are stuck in static, backward-looking month-end packs that arrive too late to support fast decisions. By layering AI-enabled analytics on top of existing ERP/EPM, BI, and Excel - grounded in governed, “investment-grade” data - teams can automate reporting narratives, move to rolling forecasts, and add prescriptive recommendations directly in the flow of work. The winning approach is incremental: start with low-risk automation, build trust through explainability and audit trails, keep humans accountable, and scale what works via repeatable workflows.
 Tips & Tricks
AI Investing: The Future of Personal Wealth
AI investing gets thrown around as a buzzword, but it can mean very different things - from buying “AI stocks” to using AI tools inside the investment process. This article focuses on the practical middle ground: how robo-advisers, systematic trading tools, and AI research co-pilots support research, portfolio construction, monitoring, and reporting. It explains where AI adds real value (speed, scale, personalization, risk and compliance) and where it can go wrong (hype, opacity, weak controls, and scams).
 Tips & Tricks
Understanding and Managing Context Windows: How to Keep Your Copilot Conversations Focused?
The article explains that Copilot context windows are the LLM’s finite, token-based “working memory,” and distinguishes this from grounding- Microsoft 365’s RAG process that searches the Microsoft Graph, retrieves relevant snippets, and injects them into the window to answer your prompt. It shows how a fixed token budget is split across system instructions, chat history, your prompt, and the response, causing truncation and behaviours like file caps (~20 files), chunking, and “lost-in-the-middle” effects. Finally, it outlines limits and a 7-step playbook to keep Copilot conversations focused and accurate.
 Tips & Tricks
How to Remove Time from Date in Excel
The article explains why you might remove time from Excel dates - to simplify datasets, avoid clutter in reports, and prevent calculation errors. It outlines multiple methods: duplicating a column and using
INTorTRUNC, changing cell formats to Short/Long Date, and usingDATEVALUEwhen the original entry is text. Troubleshooting focuses on correcting cell formats and double-checking formula syntax and references. Tips & Tricks
Advanced Research Techniques: How to Use Copilot for Synthesis and Analysis
Microsoft 365 Copilot has evolved beyond basic productivity to include two specialised agents: Researcher for multi-source knowledge synthesis with citations, and Analyst for transparent, code-backed data analysis. The article shows how structured, iterative prompts can guide these agents to integrate sources, identify themes, answer deeper questions, and organise findings for real decisions. It emphasises integrating AI into workflows while verifying sources and applying human judgment to ensure reliable, ethical outcomes.
 Tips & Tricks
How to Control Copilot's Writing Style: Getting the Tone and Format You Need
Copilot boosts productivity but can sound generic unless guided with precise, role-based instructions. Use the four pillars - Who (persona/audience), What (context and examples), How (nuanced tone), and Where (explicit structure) - to shape brand-aligned outputs. Iterate with targeted rewrite requests and reusable style guides to scale consistent, professional communication.
