- TIPS & TRICKS/
- DAX Cheat Sheet: 32 Measures With Examples/
- TIPS & TRICKS/
- DAX Cheat Sheet: 32 Measures With Examples/
DAX Cheat Sheet: 32 Measures With Examples
Every measure below is written against the same model: a Sales fact table with Amount, Quantity, UnitPrice, CustomerID, OrderDate and ShipDate; a Product table with Category and Cost; a Customer table with Region; and a Date table marked as the date table and related to Sales on OrderDate, with a second, inactive relationship on ShipDate. Swap the table and column names and the rest works as printed. Each one has a one-line note on what it does and the mistake people most often make with it.
Download the printable PDFBase aggregations
Total Sales = SUM(Sales[Amount])Order Count = COUNTROWS(Sales)Customers = DISTINCTCOUNT(Sales[CustomerID])Avg Order Value = DIVIDE([Total Sales], [Order Count])Total Cost = SUMX(Sales, Sales[Quantity] * RELATED(Product[Cost]))Iterators
Sales from Price = SUMX(Sales, Sales[Quantity] * Sales[UnitPrice])Avg per Customer = AVERAGEX(VALUES(Sales[CustomerID]), [Total Sales])Best Order = MAXX(Sales, Sales[Quantity] * Sales[UnitPrice])Category Rank = RANKX(ALL(Product[Category]), [Total Sales])CALCULATE and filters
UK Sales = CALCULATE([Total Sales], Customer[Region] = "UK")UK Sales (keep slicer) = CALCULATE([Total Sales], KEEPFILTERS(Customer[Region] = "UK"))All Sales = CALCULATE([Total Sales], REMOVEFILTERS(Sales))% of Total = DIVIDE([Total Sales], CALCULATE([Total Sales], ALL(Product[Category])))% of Selected = DIVIDE([Total Sales], CALCULATE([Total Sales], ALLSELECTED(Product[Category])))Big Orders = CALCULATE([Total Sales], FILTER(Sales, Sales[Amount] > 1000))Selected Category = SELECTEDVALUE(Product[Category], "Several")Show Total = IF(HASONEVALUE(Customer[Region]), [Total Sales])Time intelligence
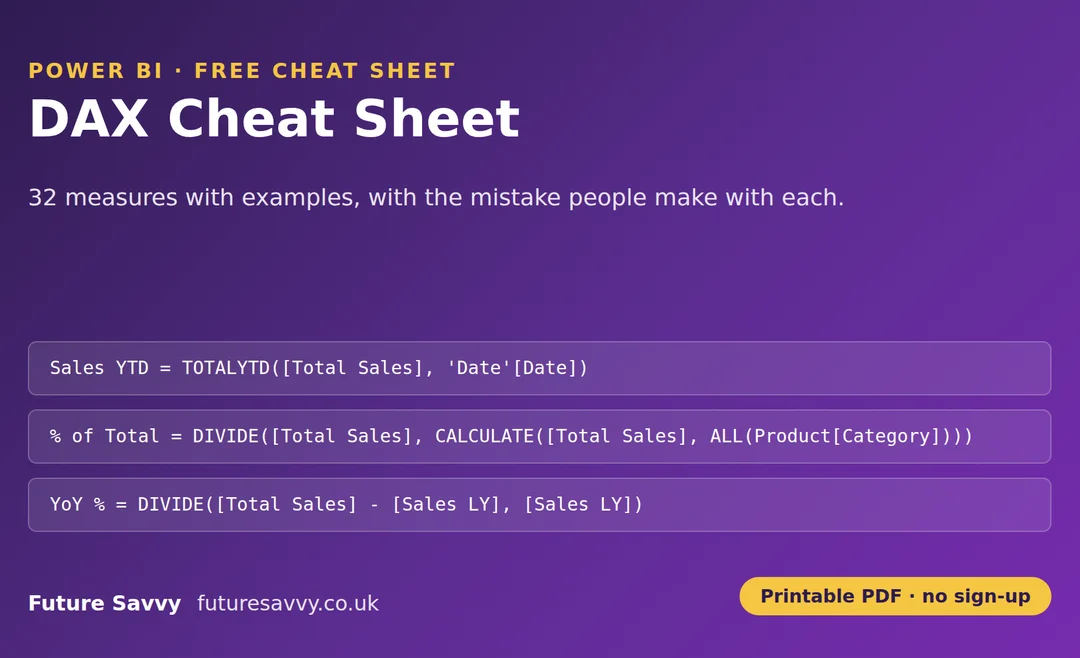
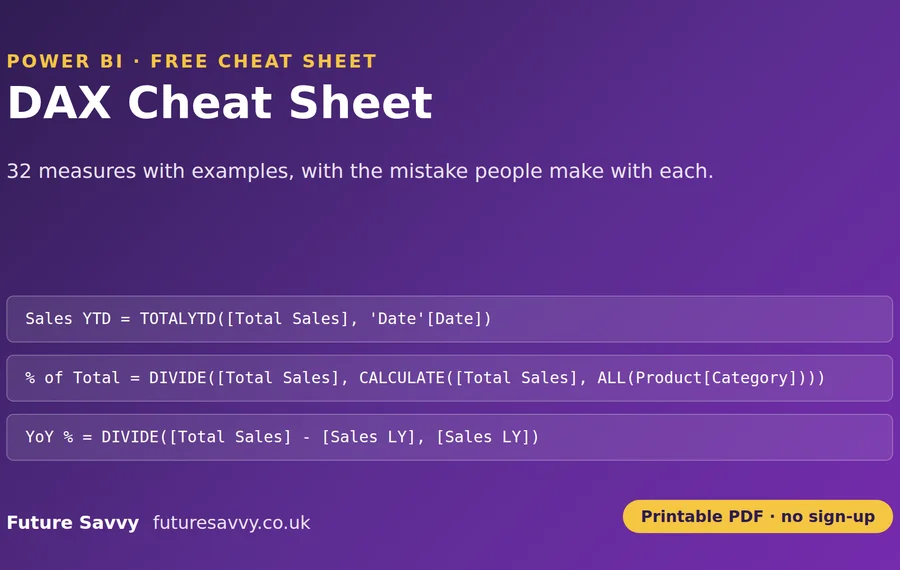
Sales YTD = TOTALYTD([Total Sales], 'Date'[Date])Sales FYTD = TOTALYTD([Total Sales], 'Date'[Date], "31/03")Sales LY = CALCULATE([Total Sales], SAMEPERIODLASTYEAR('Date'[Date]))YoY % = DIVIDE([Total Sales] - [Sales LY], [Sales LY])Sales PM = CALCULATE([Total Sales], DATEADD('Date'[Date], -1, MONTH))Rolling 12M = CALCULATE([Total Sales], DATESINPERIOD('Date'[Date], MAX('Date'[Date]), -12, MONTH))Running Total = CALCULATE([Total Sales], FILTER(ALL('Date'[Date]), 'Date'[Date] <= MAX('Date'[Date])))Sales by Ship Date = CALCULATE([Total Sales], USERELATIONSHIP(Sales[ShipDate], 'Date'[Date]))Variables and logic
Margin % =
VAR Sales = [Total Sales]
VAR Cost = [Total Cost]
RETURN DIVIDE(Sales - Cost, Sales)Target Status = IF([Total Sales] >= [Target], "Met", "Missed")Size Band = SWITCH(TRUE(), [Total Sales] >= 100000, "Large", [Total Sales] >= 10000, "Medium", "Small")Sales or Zero = COALESCE([Total Sales], 0)Sales Label = FORMAT([Total Sales], "£#,##0") & " in " & SELECTEDVALUE('Date'[Year])Categories = CONCATENATEX(VALUES(Product[Category]), Product[Category], ", ", Product[Category])Order Year = YEAR(Sales[OrderDate])Which course covers these
SUM through DIVIDE and the first CALCULATE examples are the first morning of DAX Introduction; time intelligence, iterators and USERELATIONSHIP are its second day. Power BI Introduction covers the model this sheet assumes, including marking a date table. Power BI Intermediate is where these measures meet real report design.
DAX IntroductionPower BI IntroductionPower BI IntermediateNext available dates
DAX Introduction
Live, instructor-led training with a real trainer. Book a seat on a scheduled date below, or get a quote for your team to run it privately.
26 Oct 2026
Monday · Virtual · 2 day
£825per person + VAT
26 Nov 2026
Thursday · Virtual · 2 day
£825per person + VAT
17 Dec 2026
Thursday · Virtual · 2 day
£825per person + VAT
Other courses related to this article
- Microsoft Power BIPower BI IntroductionThis 2-day introduction to Power BI gives beginners the confidence to analyse business data and build clear, effective visual reports. With hands-on guidance, you’ll learn practical skills using real-life data, quickly becoming comfortable with core Power BI functions that make work easier and more insightful.2 Days · Classroom or on-site
- Microsoft Power BIPower BI IntermediateThis course is perfect for those already using Power BI who want to move beyond the basics. Through interactive, practical exercises, you’ll gain experience working with real-world data to develop your analytical skills and enhance your reporting capability.1 Day · Classroom or on-site
Ready to train your team?
Tell us what you need and we'll come back to you with a detailed quote.
- Tailored contentBuilt around your team's work and skill levels.
- Flexible schedulingDates and times that suit your team, not ours.
- Your place or onlineDelivered at your office or virtually.
- Better value per headOne trainer, one day, your whole team.
- A dedicated trainerYour team gets all of the trainer's attention.
- Realistic examplesSample data built around the kind of work your team does.
We reply with available dates and a price for your team. No obligation.
Related Articles
 Tips & Tricks
Can you Calculate Variance Using Excel?
In this guide, we explain variance as a measure of how widely data points deviate from the mean and shows why understanding this spread is useful for deeper insight and risk assessment. It walks readers through calculating variance in Excel, distinguishing between the VAR.S function for a sample and VAR.P for an entire population, then demonstrates each with a car-sales case study.
 Tips & Tricks
How to Use Excel Lookup with Multiple Criteria
This blog explains how Excel’s LOOKUP functions—particularly XLOOKUP and VLOOKUP—can retrieve data based on multiple criteria. It walks through a step-by-step example of finding an employee’s sales in a specific region, showing both an XLOOKUP formula and a VLOOKUP alternative that uses a helper column.
 Tips & Tricks
Excel Skills Self-Assessment Questionnaire
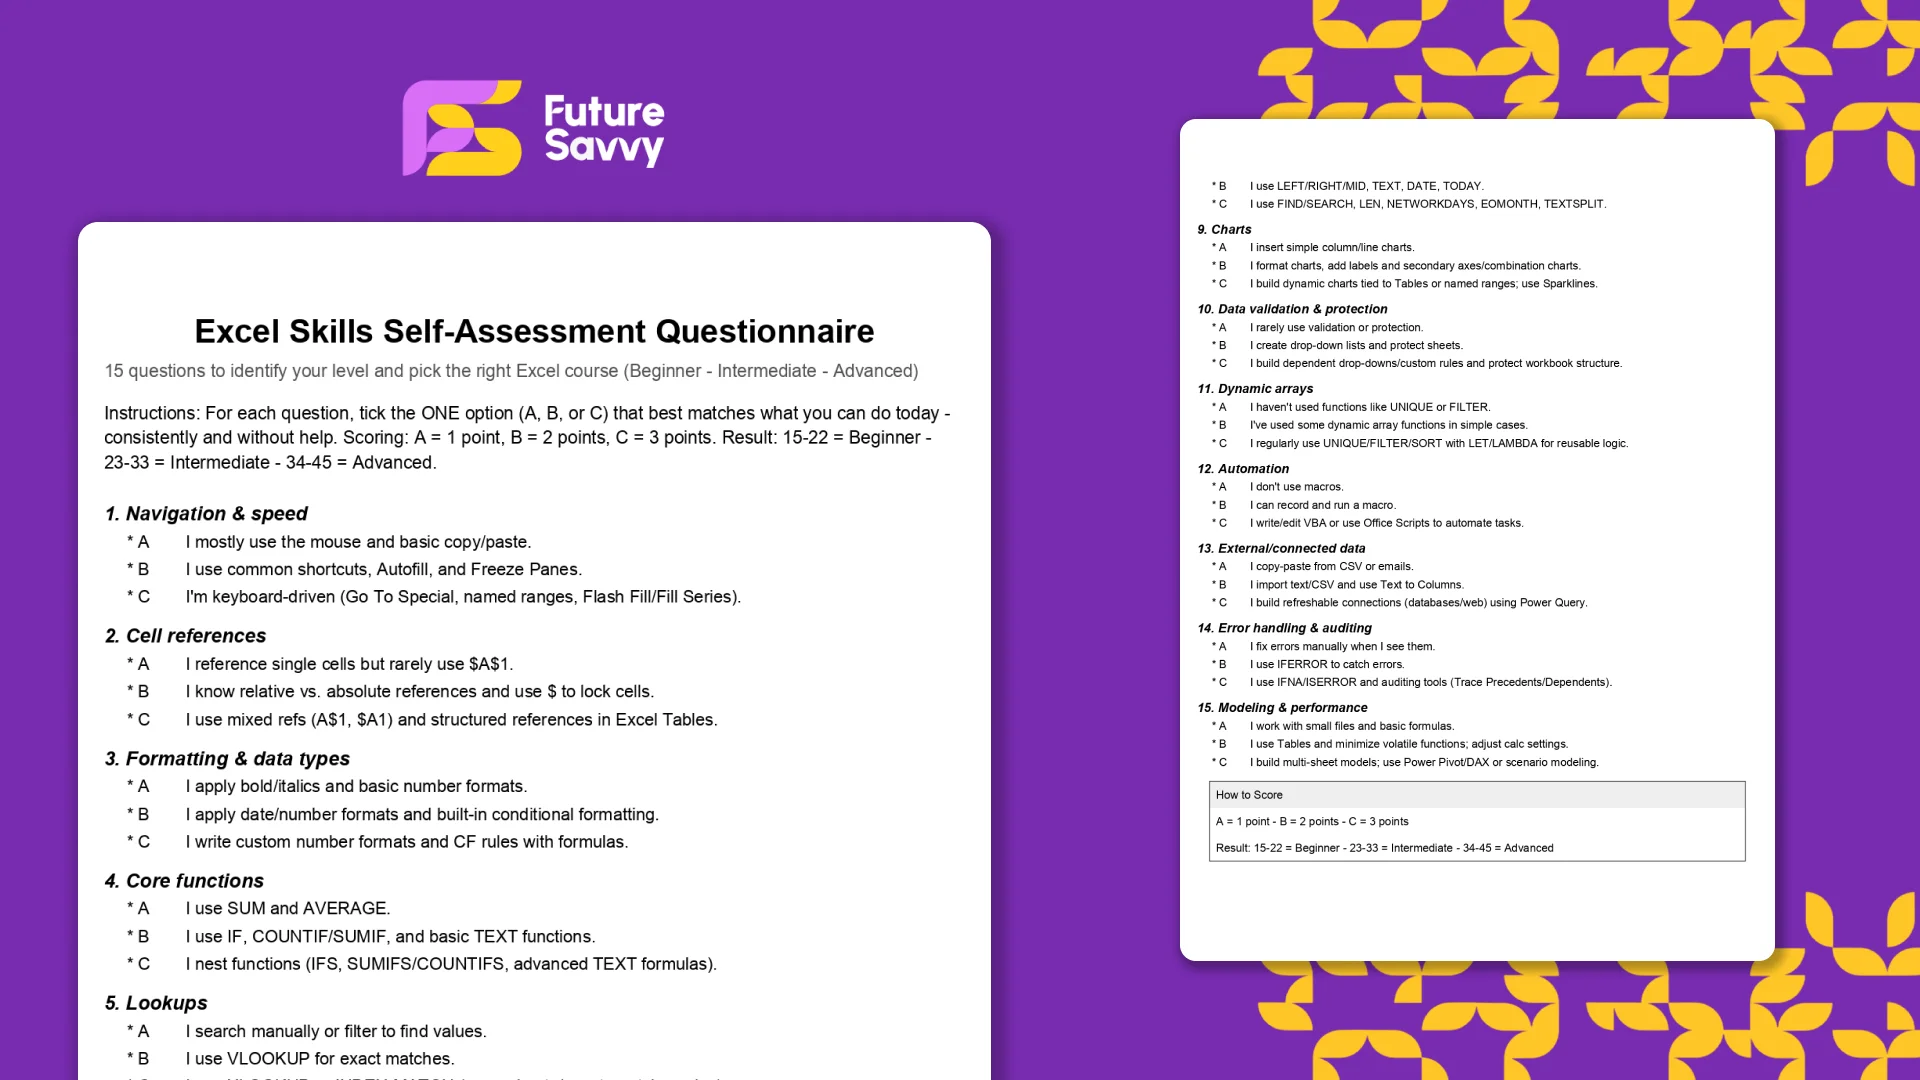
This free, printable Excel Skills Self-Assessment helps you quickly gauge your level and pick the right next step in your learning path. It contains 15 multiple-choice questions spanning navigation, formulas, lookups, tables, PivotTables, charts, dynamic arrays, Power Query, and more. You’ll score yourself and interpret the result to see whether you’re Beginner, Intermediate, or Advanced - then follow tailored course recommendations based on your score.
Insights for modern teams
Stay ahead with our latest learning trends, tools, and success stories. Enter your email address below to receive updates from us.