- TIPS & TRICKS/
- SQL for Non-Developers: The 6 Queries That Answer 90% of Business Questions/
- TIPS & TRICKS/
- SQL for Non-Developers: The 6 Queries That Answer 90% of Business Questions/
SQL for Non-Developers: The 6 Queries That Answer 90% of Business Questions
Every business has the same bottleneck: the answers live in a database, and only a handful of people can get them out. Everyone else queues for the report, the export, or the person who "does SQL" to come back from leave.
You don't need to be a developer to fix that for yourself. SQL, the language behind almost every business database, is built from a small number of repeating patterns. Six of them cover the vast majority of everyday questions: which rows, how many, how much, per what, sorted how, across which tables.
This guide works those six patterns end to end on a real database. Every query below was actually run, and every screenshot shows its real result: the row counts and totals in the text are the ones you can see in the grids. Nothing here is pseudo-code.
The database we'll use
Our worked example is BrightOffice, a fictional office-supplies wholesaler. Its database has two tables: customers holds 15 firms across Leeds, Manchester, Sheffield, York and Liverpool, and orders holds 460 orders from January 2025 to August 2026, each with a date, a product category and an order total.
We're using Microsoft SQL Server and its standard tool, SQL Server Management Studio (SSMS): the same pairing our SQL courses teach, and the one you're most likely to be handed at work. If your company runs PostgreSQL or MySQL instead, the window furniture differs but the six patterns barely do. You type a query, you run it, and a grid of results comes back.
To follow along at work you need exactly two things: read access to a table that matters to you (ask whoever manages the database; sales, orders and tickets are the usual starters), and whichever query tool your IT team already uses.
One thing to know before you start: a query reads top to bottom in the order you write it. SELECT which columns, FROM which table, then any filtering, grouping and sorting. Each pattern below adds one line to that story, and by the end you'll combine all six in a single query.
SELECT: get the columns you actually need
SELECT company_name, city, account_since
FROM customers;This is the skeleton every other pattern hangs off: SELECT the columns you want, FROM the table they live in. Run against BrightOffice it returns all 15 customers, and only the three columns we asked for. The status bar under the results grid confirms the row count.
Resist the SELECT * habit (the star means "every column"). Naming columns keeps the result readable, and it makes the next step, filtering, much easier to think about because you can see exactly what you're filtering.
WHERE: filter down to what matters
SELECT order_id, order_date, product_category, order_total
FROM orders
WHERE order_date >= '2026-01-01';WHERE answers "which ones". BrightOffice's orders table holds 460 rows; add one line and the grid comes back with the 184 orders placed since the start of 2026. The filter runs in the database, not in your head or a spreadsheet, so you never scroll past rows you didn't want.
Conditions stack with AND. Suppose the question is really "which of this year's orders were big":
SELECT order_id, order_date, product_category, order_total
FROM orders
WHERE order_date >= '2026-01-01'
AND order_total > 500;That's 460 rows down to 184, down to 16. Every one of the 16 is a this-year order over £500, and every one of them is Furniture: a fact about BrightOffice's business you've just discovered by stacking two filters.
ORDER BY: put the most useful rows first
SELECT order_id, order_date, product_category, order_total
FROM orders
ORDER BY order_total DESC;ORDER BY sorts the result: DESC for biggest or most recent first, ASC (the default) for the reverse. Sorted by value, BrightOffice's biggest-ever order sits at the top of the grid, a £996.09 furniture order from March 2025. "Top ten anything" is this pattern plus TOP 10 straight after the SELECT, which keeps just the first ten rows of the sorted result.
GROUP BY: one row per category
SELECT product_category,
       COUNT(*) AS orders_placed,
       SUM(order_total) AS total_spend
FROM orders
GROUP BY product_category
ORDER BY total_spend DESC;This is where SQL starts doing what you'd otherwise build a pivot table for. GROUP BY collapses rows into one line per category, and the functions in the SELECT, here COUNT and SUM, summarise each group. (AS just names the new columns.)
Look at what the five rows actually say: furniture is BrightOffice's rarest order type, 46 orders out of 460, and its biggest earner at £34,893.64. Paper and envelopes were ordered three times as often and brought in barely a quarter as much. One six-line query, and you know which category deserves the sales push. That sentence is what GROUP BY exists to produce.
The gotcha that trips everyone up first: every column in theSELECTthat isn't being summarised must also appear in theGROUP BY. Hereproduct_categoryis in both; that's the rule being followed, not a coincidence. The database can't put 460 different order dates on five summary rows, so it refuses to guess.
JOIN: pull data from more than one table
Business data almost never lives in one table. BrightOffice's orders table doesn't store company names; it stores a customer_id like 101, and the name lives once in customers. That's deliberate good design, and JOIN is how you stitch the two back together when a human needs to read the result:
SELECT customers.company_name, orders.order_date, orders.order_total
FROM orders
JOIN customers ON orders.customer_id = customers.customer_id;The ON clause is the matching rule: rows pair up where the customer_id values agree. The grid now shows a company name against every order, and it still shows exactly 460 rows, one per order. That unchanged count is worth noticing; a join that suddenly returns far more rows than you started with is a warning sign we'll come back to in the gotchas.
COUNT, SUM, AVG: the numbers behind the question
You've met COUNT and SUM inside the GROUP BY, but they work on their own too. With no grouping, the whole result collapses to a single row of headline numbers:
SELECT COUNT(*) AS orders_placed,
       SUM(order_total) AS revenue,
       CAST(AVG(order_total) AS decimal(10, 2)) AS average_order
FROM orders
WHERE order_date >= '2026-01-01';BrightOffice's year to date, straight off the grid: 184 orders, £30,009.70 of revenue, £163.10 average order. The three functions read exactly as they sound. COUNT(*) counts rows, SUM totals a numeric column, and AVG averages it (the CAST just trims the average to two decimal places for display).
Put together with the other five patterns, that's most of what "can you pull me a number on X" turns out to mean.
Putting all six together
Here's a question a sales manager would actually ask: "Which customers have spent over £2,000 with us this year, and how many orders did that take?" Every pattern from this guide, one query:
SELECT customers.company_name,
       COUNT(*) AS orders_placed,
       SUM(orders.order_total) AS total_spend
FROM orders
JOIN customers ON orders.customer_id = customers.customer_id
WHERE orders.order_date >= '2026-01-01'
GROUP BY customers.company_name
HAVING SUM(orders.order_total) > 2000
ORDER BY total_spend DESC;Read it top to bottom: join orders to customer names, keep this year's orders, collapse to one row per customer, keep only the customers whose total clears £2,000, biggest first. The answer is six firms, led by Kingfisher Travel with 13 orders and £3,078.37.
The one new word is HAVING: it filters groups after they've been summarised, which WHERE can't do because WHERE runs before the grouping exists. Rule of thumb: conditions on raw rows go in WHERE, conditions on totals go in HAVING.
Common gotchas (and the fixes)
“Column ... is invalid in the select list because it is not contained in either an aggregate function or the GROUP BY clause.” SQL Server's wording of the most common first error. Every plain column in your SELECT needs to be in the GROUP BY too; only summarised columns (inside COUNT, SUM, AVG) are exempt. Fix: add the column to GROUP BY, or wrap it in an aggregate.
A JOIN returns far more rows than expected. The matching rule is pairing more rows than you intended, usually because the ON column isn't unique on one side. Healthy sign: our join returned exactly the 460 orders we started with. If 460 becomes 4,600, fix the join before you trust anything downstream.
A date filter behaves oddly. Write dates as 'YYYY-MM-DD' and prefer >= and < boundaries over BETWEEN. If the column stores a time as well as a date, <= '2026-08-31' silently cuts off everything after midnight on the 31st; use < '2026-09-01' instead.
The total looks plausible but is wrong. Almost always a JOIN duplicating rows before a SUM, so each duplicated row is counted twice. Check the un-summarised row count first (gotcha two), then sum. A number that's exactly 2x or 3x what you expected is this bug's signature.
You can answer your own questions now
Six patterns (SELECT, WHERE, ORDER BY, GROUP BY, JOIN and the COUNT/SUM/AVG family) took a 460-row orders table from "ask IT" to "which six customers cleared £2,000 this year, sorted". The same six will do it on your sales table, your ticket queue, your sign-up log.
If you'd rather build this skill hands-on, on realistic business scenarios with a trainer in the room to answer the "why did that error happen?" questions the moment they happen, that's exactly what our instructor-led SQL courses are for.
See our SQL training coursesNext available dates
SQL Introduction to Querying
Live, instructor-led training with a real trainer. Book a seat on a scheduled date below, or get a quote for your team to run it privately.
1 Dec 2026
Tuesday · Virtual · 2 day
£825per person + VAT
4 Feb 2027
Thursday · Virtual · 2 day
£825per person + VAT
5 Apr 2027
Monday · Virtual · 2 day
£825per person + VAT
Other courses related to this article
Ready to train your team?
Tell us what you need and we'll come back to you with a detailed quote.
- Tailored contentBuilt around your team's work and skill levels.
- Flexible schedulingDates and times that suit your team, not ours.
- Your place or onlineDelivered at your office or virtually.
- Better value per headOne trainer, one day, your whole team.
- A dedicated trainerYour team gets all of the trainer's attention.
- Realistic examplesSample data built around the kind of work your team does.
We reply with available dates and a price for your team. No obligation.
Related Articles
 Tips & Tricks
Can you Calculate Variance Using Excel?
In this guide, we explain variance as a measure of how widely data points deviate from the mean and shows why understanding this spread is useful for deeper insight and risk assessment. It walks readers through calculating variance in Excel, distinguishing between the VAR.S function for a sample and VAR.P for an entire population, then demonstrates each with a car-sales case study.
 Tips & Tricks
How to Use Excel Lookup with Multiple Criteria
This blog explains how Excel’s LOOKUP functions—particularly XLOOKUP and VLOOKUP—can retrieve data based on multiple criteria. It walks through a step-by-step example of finding an employee’s sales in a specific region, showing both an XLOOKUP formula and a VLOOKUP alternative that uses a helper column.
 Tips & Tricks
Excel Skills Self-Assessment Questionnaire
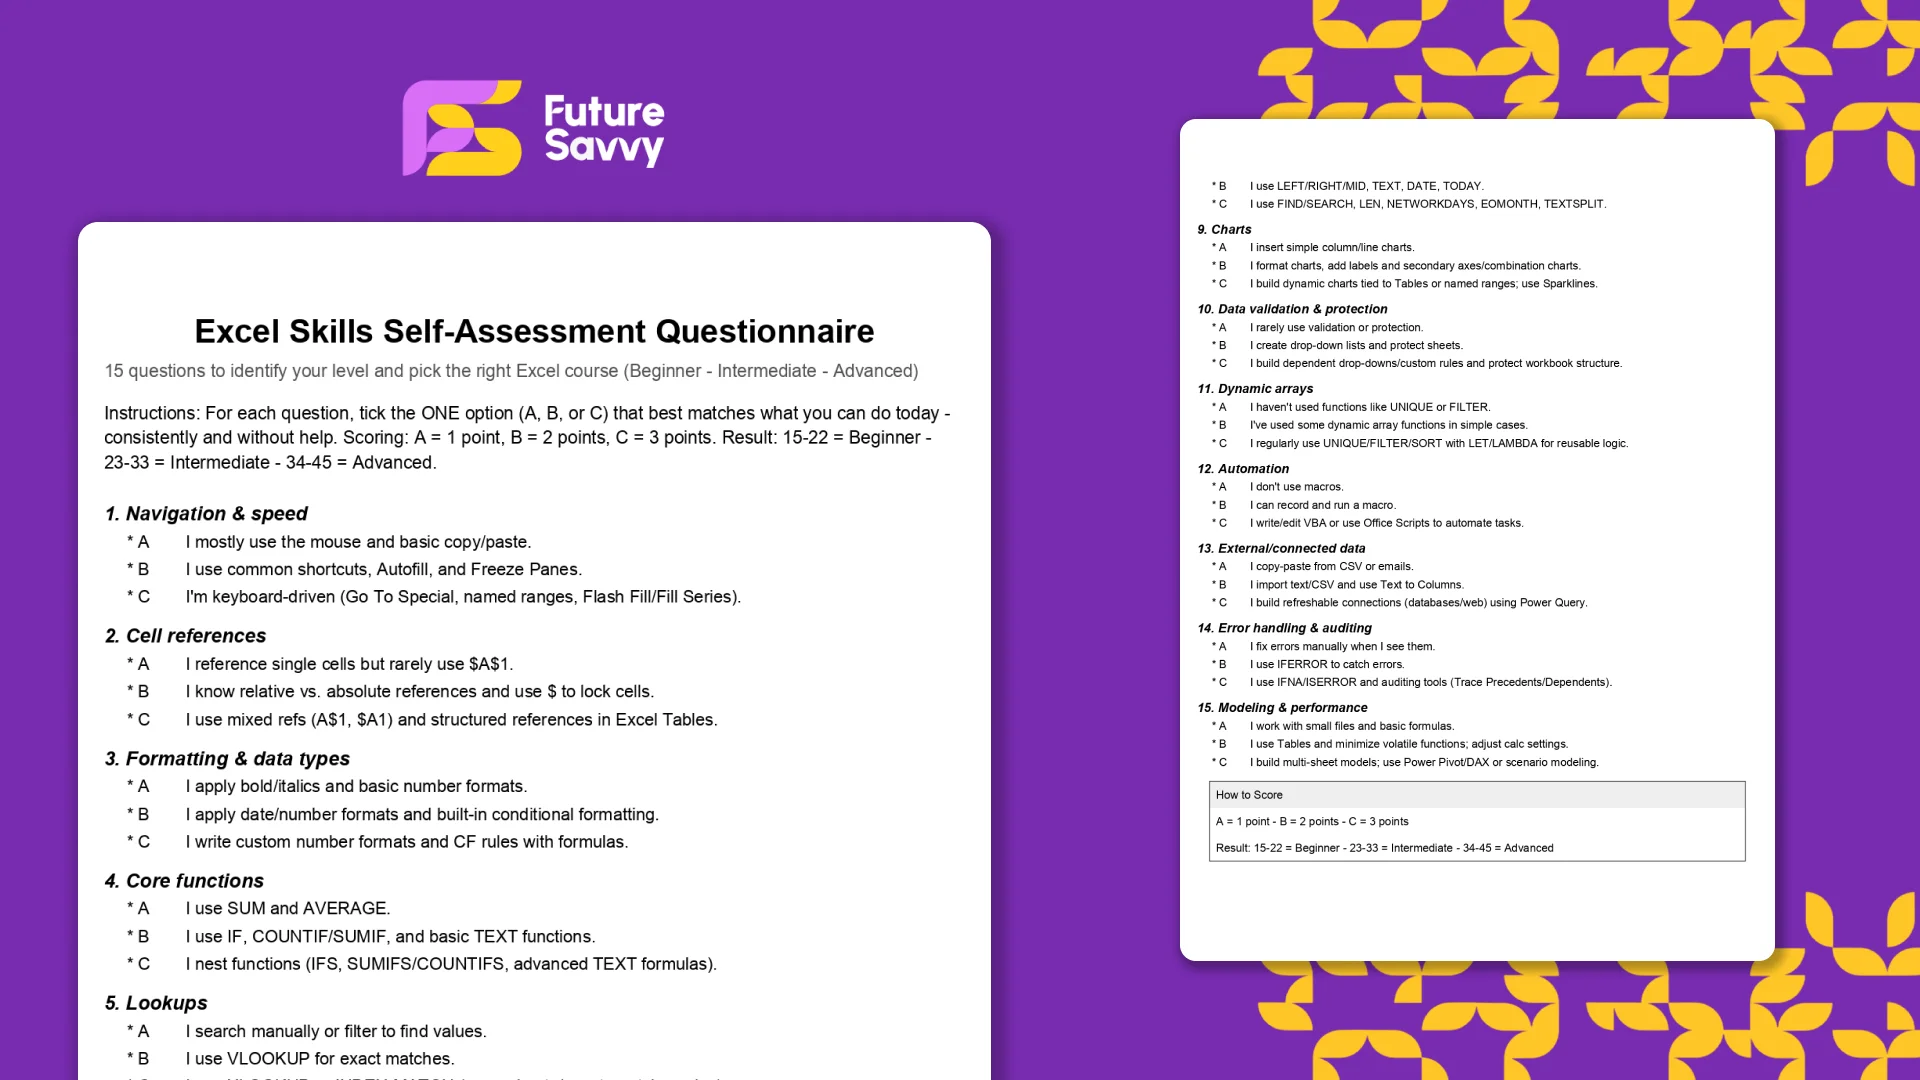
This free, printable Excel Skills Self-Assessment helps you quickly gauge your level and pick the right next step in your learning path. It contains 15 multiple-choice questions spanning navigation, formulas, lookups, tables, PivotTables, charts, dynamic arrays, Power Query, and more. You’ll score yourself and interpret the result to see whether you’re Beginner, Intermediate, or Advanced - then follow tailored course recommendations based on your score.
Insights for modern teams
Stay ahead with our latest learning trends, tools, and success stories. Enter your email address below to receive updates from us.