- TIPS & TRICKS/
- How to Calculate Running Total in Excel/


How to Calculate Running Total in Excel
- TIPS & TRICKS/
- How to Calculate Running Total in Excel/
How to Calculate Running Total in Excel
Excel has a variety of features and functions to help companies better manage their finances and businesses as a whole. However, few are as useful as running totals. Calculating running totals gives you real-time insights about your data, without having to manually make calculations every time you want to analyse the data.
This guide is going to help you learn more about running totals in Excel and go over three simple techniques you can use to calculate them in Excel.
Upskill your team with live, instructor-led Excel training tailored to your business needs.
Understanding Running Totals in Excel
A running total in Excel, which is also known as a cumulative sum, tracks how values add up over time and shows the ongoing sum of the entire dataset. It’s dynamic, as each time you add a new sum value, it’s added to the total as you go down the column.
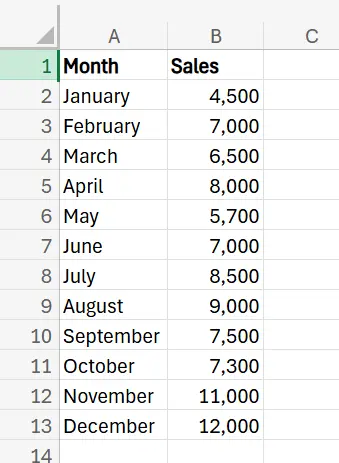
For example, if you’re tracking your sales and you sold 4,500 in January, 7,000 in February, and 6,500 in March, the running total would be 4,500, then 11,500, and finally 18,000.
While they’re often used for tracking sales over time, businesses may use running totals to monitor expenses, keep track of inventory, identify trends, forecast more accurately, and observe progress.
How to Calculate a Running Total in Excel: 3 Techniques
There are three main techniques you can use to calculate a running total in Excel, and here are the steps involved in each one.
Using the SUM Function
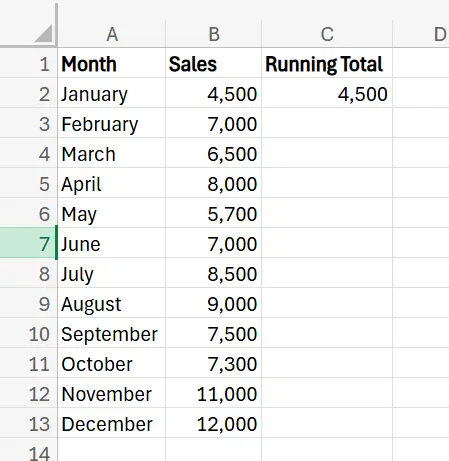
1. Open your dataset that includes the data you want to create a running total for. In the case of this example, this is the sales data for a company.
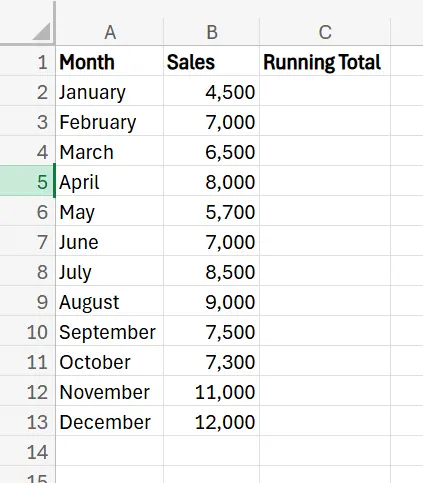
2. Add a new column next to the Sales, which you can title “Running Total” or anything else you want.
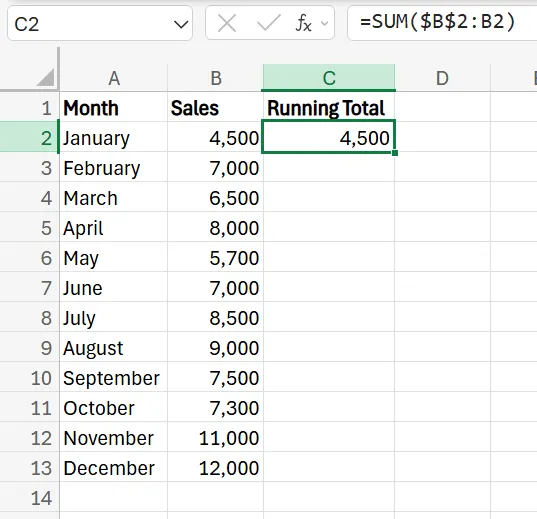
3. In the first cell of this new column, enter =SUM($B$2:B2). You use an absolute reference on the first cell, so you lock the starting point of the calculation, but the ending point changes with each new cell you add.
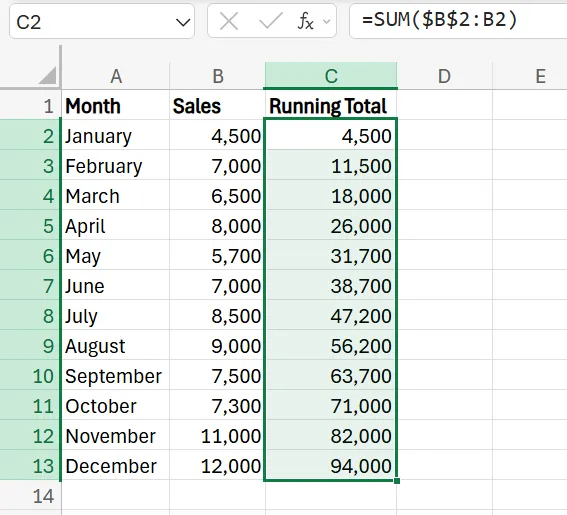
4. Click the bottom right corner of the cell with this SUM function and drag it down over the rest of the dataset to apply the calculation to the entire set. The running total column will automatically populate with the correct data. If you add more months and their sales in more columns and rows, simply drag the formula down further, and the results will automatically populate.
Using a Formula
1. Begin with the same original dataset as the last technique, and add a Running Total column next to the sales column again.
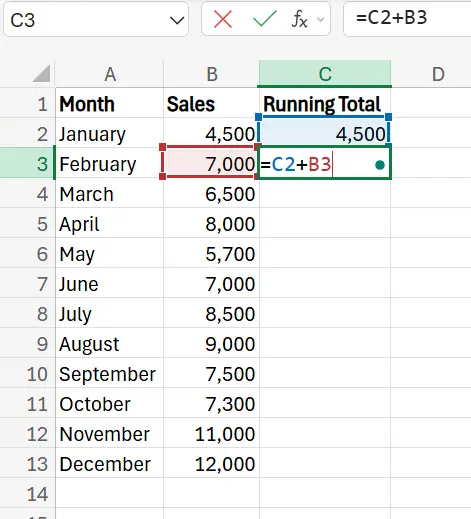
2. In the first cell of the Running Total column, add the sales from the first month of the dataset, which in this case is 4,500.
3. In the next cell down (C3 in this example), enter =C2+B3 and hit Enter.
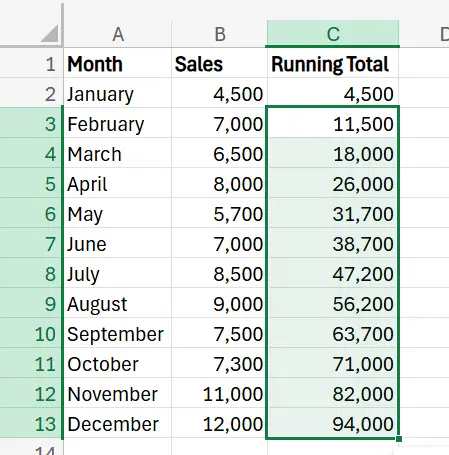
4. Drag the formula down across the rest of the dataset, and it’ll automatically populate the column with the correct running totals. Like the last method, you can simply drag the formula down further if you need to add additional columns.
Using the Quick Analysis Tool
- Select the range of the cells you want to calculate the running totals for, and click the Quick Analysis button at the bottom right of the range. If there’s no button, you can also press Ctrl + Q to open Quick Analysis.
- In the menu that appears, go to the Totals tab, and click Running Total.
- After clicking that option, Excel automatically calculates and displays the running total for the dataset.
Mistakes to Avoid When Calculating Running Totals in Excel
When calculating running totals in Excel, there are a few mistakes you should look out for.
Watch for Blank Cells
If your dataset contains blank cells, it may lead to issues and unexpected errors in your results. Thankfully, the fix for this is easy, as you can simply add a “0” to any blank cells to stop these issues from happening. You may also use an IF function if you want the formula to be able to handle blank cells without causing issues.
Improper Cell References
If you reference the wrong cells in certain places, your running total calculation won’t be accurate and may be full of errors. To fix this, simply check that the cells you’re referencing in your functions and formulas are correct and in the proper places. In a similar vein, don’t forget about using absolute references when needed to make sure your calculation is dynamic.
Data in the Incorrect Order
For a running total calculation to work properly, you need to ensure your data is in the right order. If the data is all out of place (such as the months being in the wrong places, or the numbers themselves being wrong), it’ll throw off the calculation, and the results won’t be right. To avoid this issue, take time to ensure the data in the set is ordered correctly before calculating the running total.
Get in touch today to discuss the next steps for growing your business!
Related Articles
 Tips & Tricks
How to Calculate Age in Excel
Learn how to calculate age from a date of birth in Excel using the DATEDIF function, plus alternatives like YEARFRAC and INT for greater precision. This step-by-step guide covers cell formatting, formula entry, and quick copying, and explains why age calculations matter for HR planning, customer insights, and resource allocation.
 Tips & Tricks
Design a Cashflow Forecast Template in Excel
A cash-flow forecast template in Excel lets businesses track incoming and outgoing cash, spot shortfalls early, and plan investments confidently. The guide walks you through structuring rows for receipts and payments, columns for time periods, and using SUM-based formulas to automate totals and month-end balances.
 Tips & Tricks
How to Compare Two Columns in Excel
This article explains how to easily compare two columns in Excel, especially when working with large datasets. It outlines common methods such as using formulas like IF, EXACT, and VLOOKUP, as well as conditional formatting to highlight differences or similarities. The guide also covers why column comparison is useful for identifying duplicates, missing values, and patterns in data. Finally, it offers best practices like ensuring data compatibility, verifying formulas, and labelling columns clearly for accuracy.
