- TIPS & TRICKS/
- Design a Cashflow Forecast Template in Excel/


Design a Cashflow Forecast Template in Excel
- TIPS & TRICKS/
- Design a Cashflow Forecast Template in Excel/
Design a Cashflow Forecast Template in Excel
Forecasting your cash flow is an important part of running a business, as it helps you plan for the future, maintain financial stability, and make better decisions. While there are a variety of ways your business can make these forecasts, creating them in Excel is a common choice.
This guide goes over everything you need to know about creating a cash flow forecast template in Excel, including how to do it, why you should use one, and ways to improve and optimise your forecast.
If you want to learn more about data visualisation in Excel, check out our instructor-led training courses!
Why Use a Cash Flow Forecast Template in Excel?
There are many reasons why using a cash flow forecast template in Excel is smart. Firstly, it’s great for gaining more insights into your cash flow. You’ll be able to see and track the funds coming in and how much is going out (and where it’s going).
This helps you understand not only your profit and margins, but also if there are areas where you feel you’re spending too much.
Having these financial insights helps you plan future investments or purchases, identify growth opportunities, allocate resources, and ensure your business remains financially stable. Forecasting can also help you identify potential financial problems down the road and take action to correct the issue before it harms your business.
Also, creating a template means you can easily make adjustments to your forecasts and data without starting from scratch every time.
Key Features of an Effective Cash Flow Forecast Template
Some key features that your cash flow forecast template in Excel should include are:
- Properly defined and labelled time periods, categories, columns, and rows
- All of your cash receipts (sales, investment income, loan income, etc…)
- All of your cash payments (rent, utilities, employee salaries, debt payments, taxes, cost of goods, etc…)
- Accurate past data and realistic sales and expense forecasts
- A clear layout, complete with different colours and customisation to make it more visually appealing and/or easier to read
- The correct functions and calculations to automate the cash flow forecast
Step-by-Step Guide to Creating a Cash Flow Forecast in Excel
Let’s have a look at the process for creating a cash flow forecast in Excel.
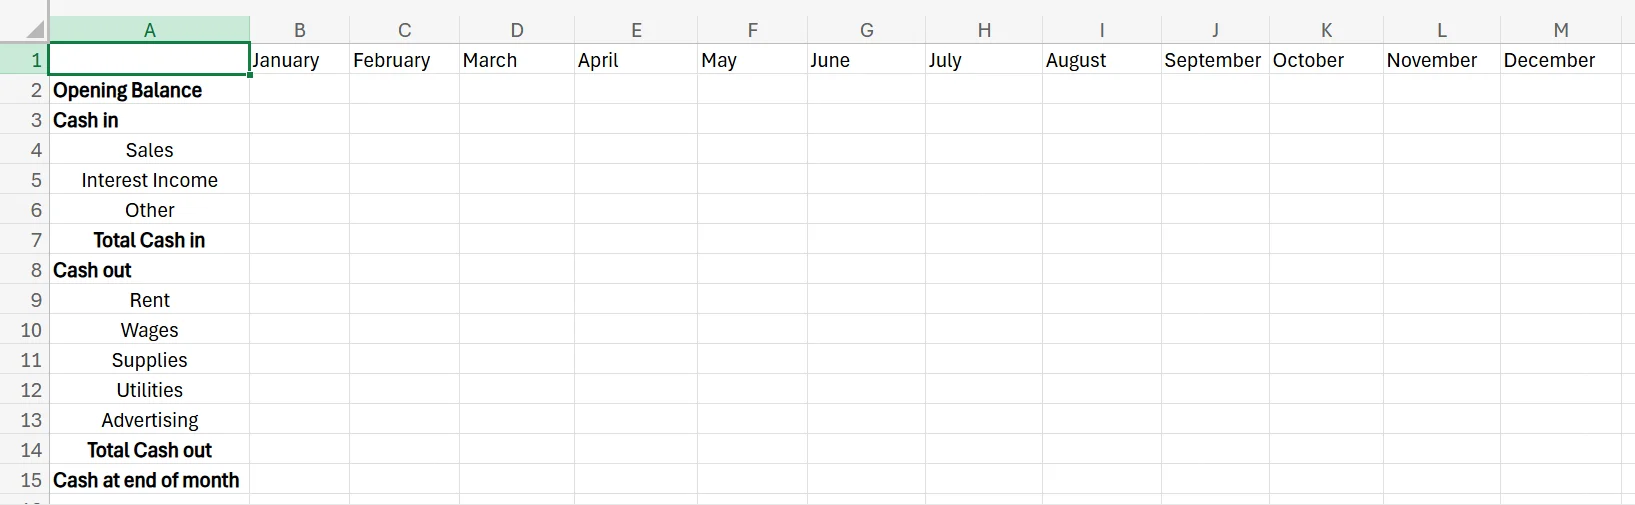
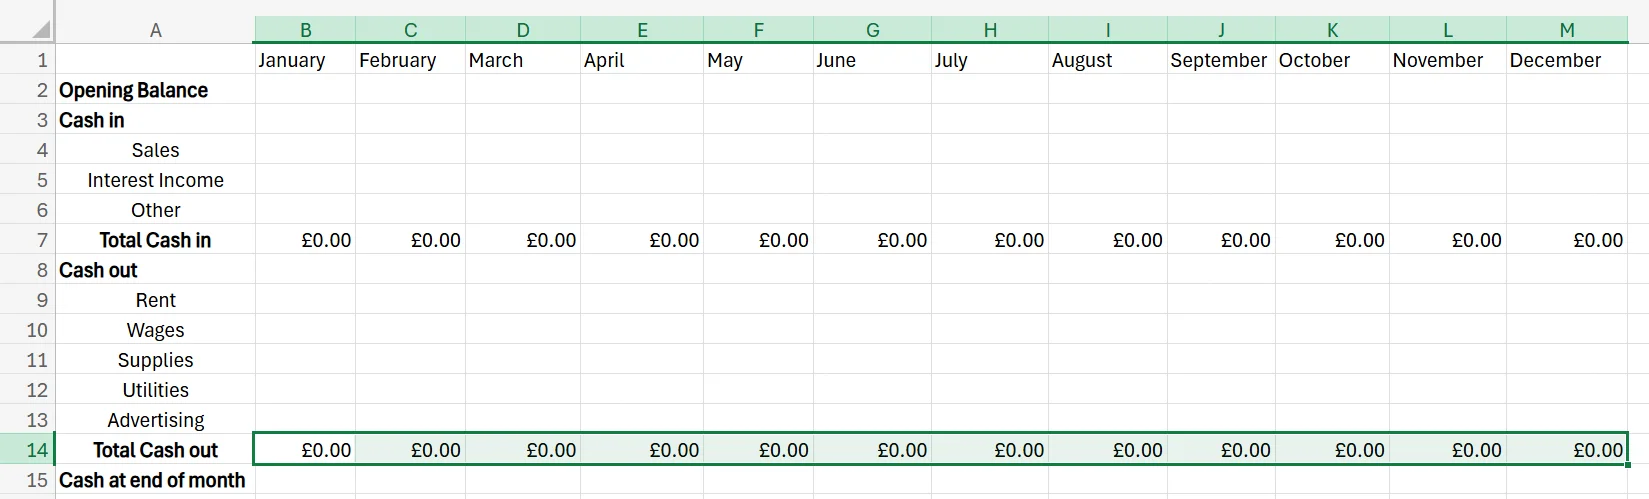
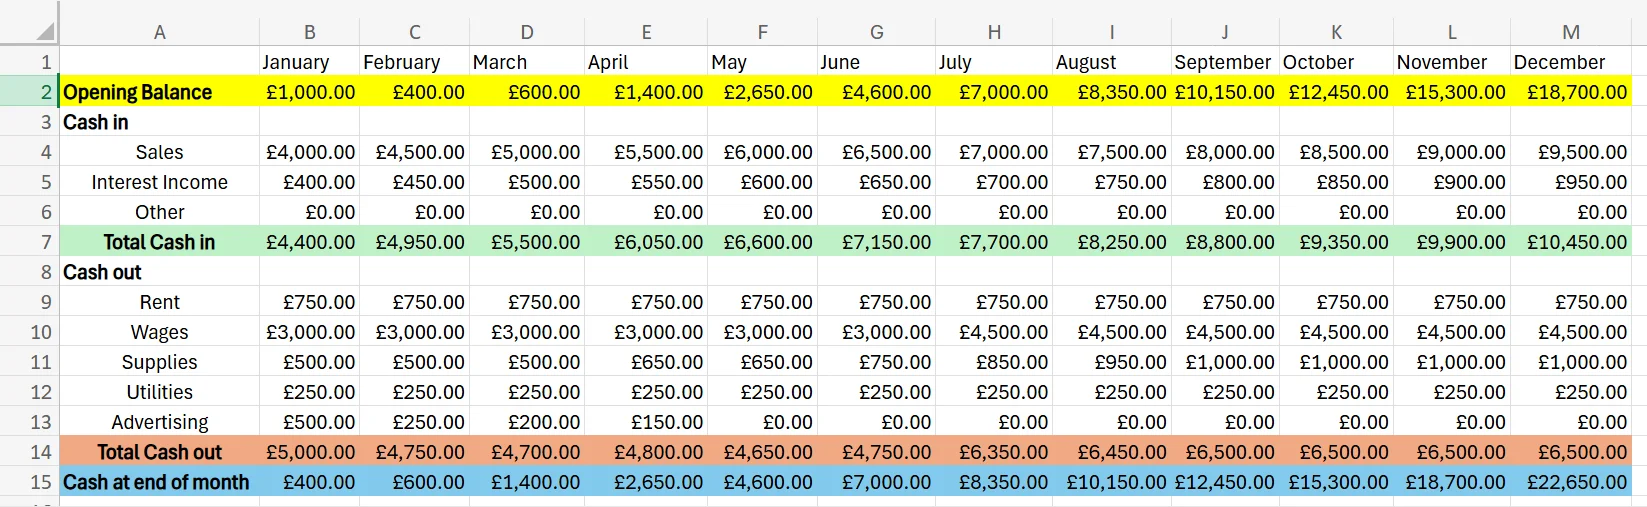
1. Create the template by designating your rows and columns based on the things that you’re forecasting (rows), as well as the time periods you’re using (columns). In this example, we’re using each of the 12 months as its own column, but you could organise it by week, by year, or in any configuration that works best for your needs.
The exact rows you include (and how many there are) depend on how many different sources of cash you have, as well as how many expenses you need to pay each time period. For some businesses, this may be as simple and short as the example, while others may require larger and more detailed forecast templates. Be as detailed as possible here so you don’t miss any sources of cash or payments.
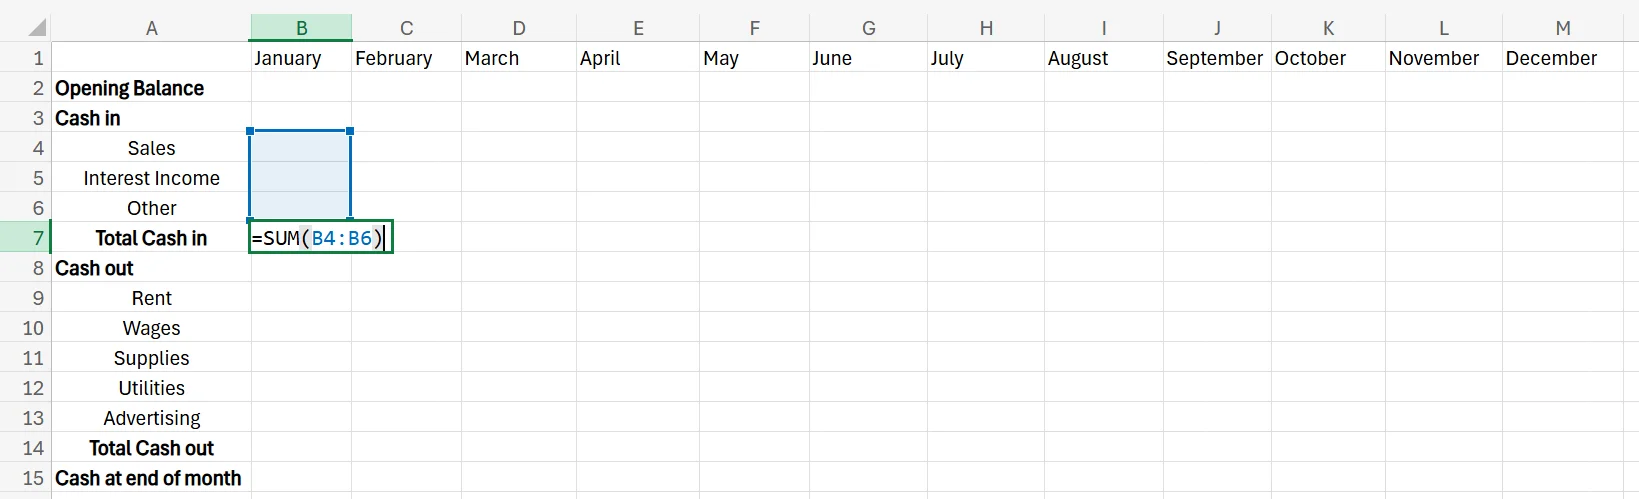
2. Once you have each column and row titled properly, head to the “Total Cash in” cell (or whatever you decide to call it) and enter =SUM, and then drag down each row that is a part of your total cash in, which is Sales, Interest Income, and Other in this example. Another option is to simply enter the cell numbers directly by typing =SUM(B4:B6).
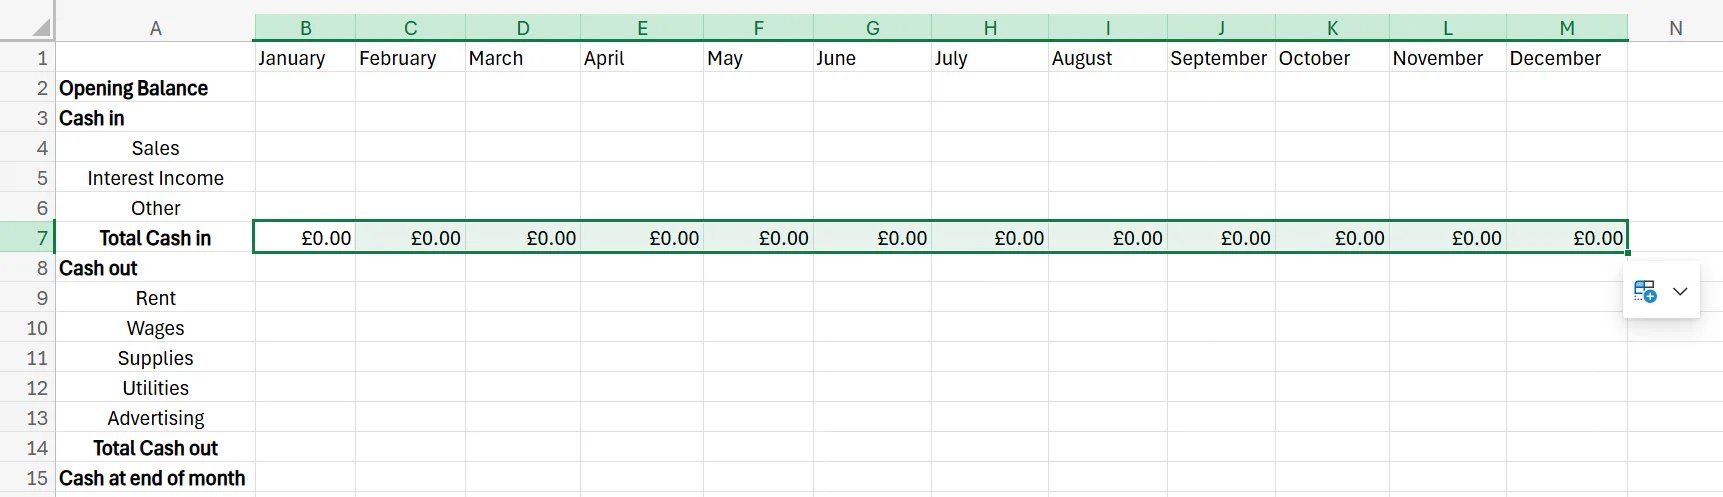
3. Drag the formula across the rest of your months to instantly apply it to them. Do this by clicking the bottom-right corner of the cell and dragging it.
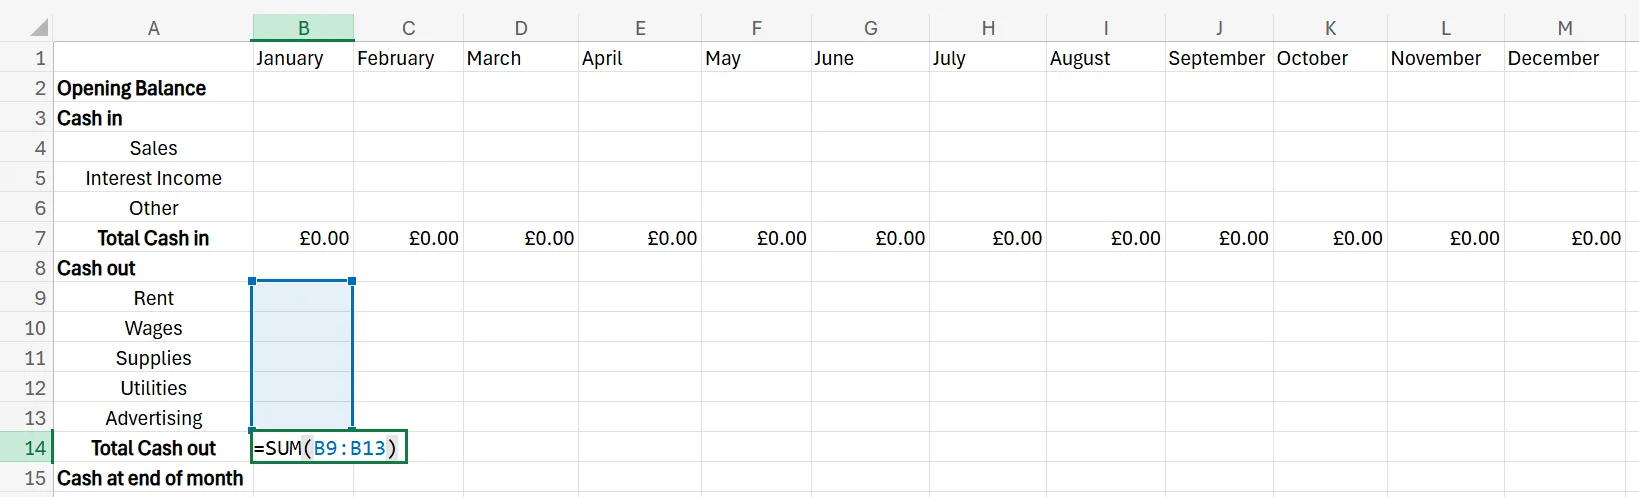
4. Move to the first cell in the “Total Cash out” row (or your equivalent), and repeat the process in step 2 by entering =SUM and either dragging across the different expenses or entering the cells directly.
5. Once again, drag the formula across the months.
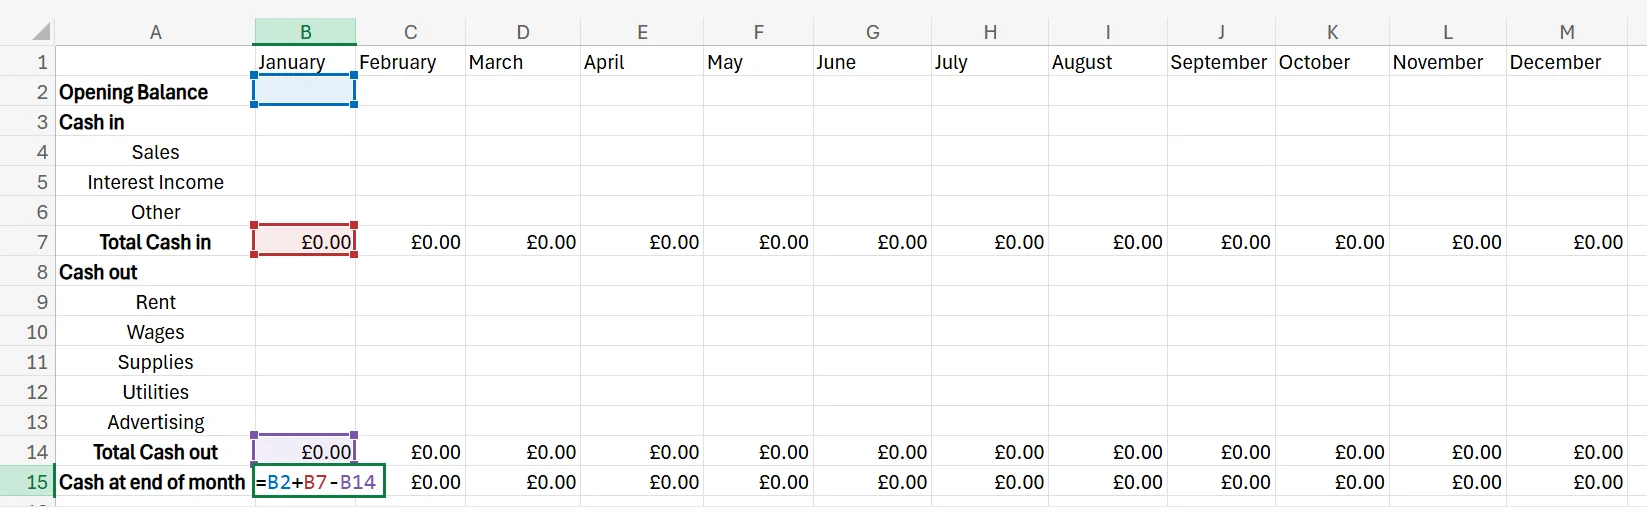
6. Next, add a formula to the first cell in your “Cash at the end of the month” (or equivalent) row. It should calculate the sum of your opening balance and total cash in and then subtract the total cash out. In this example, this would be =B2+B7-B14. Again, drag this formula across and apply it to the rest of the months.
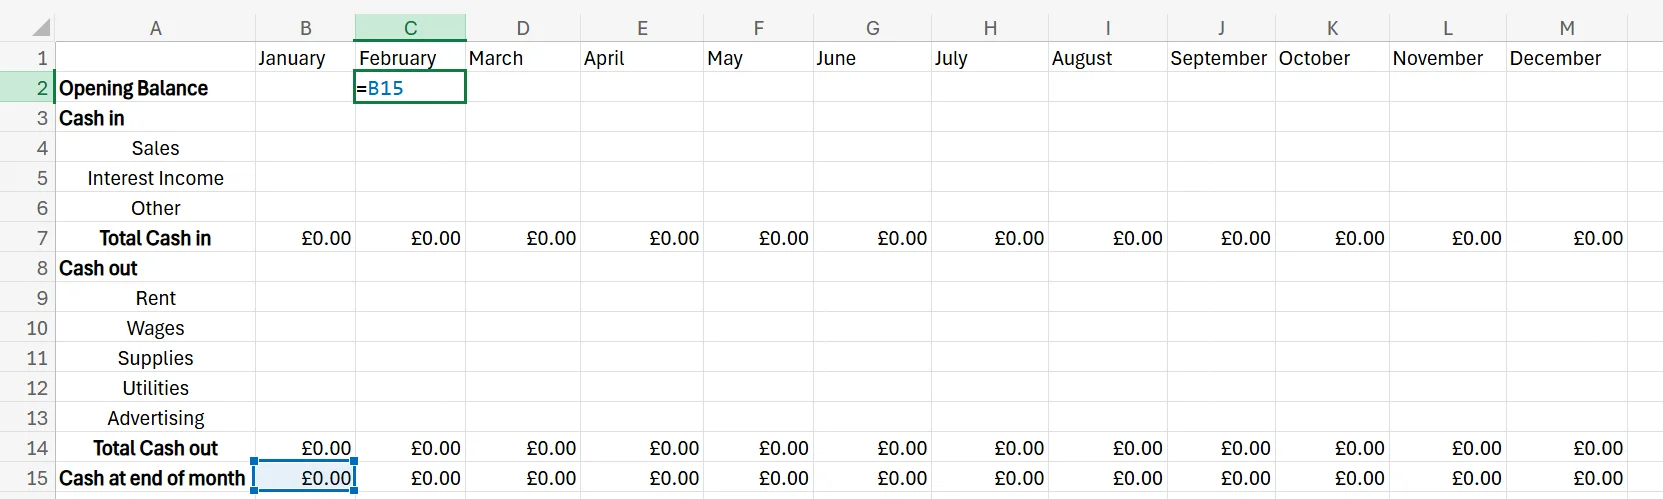
7. Next, choose the cell for the opening balance of your second month, and add =cell number of the cash at the end of the last month. In this case, it’d be =B15. Drag it to apply this to each of the next months, as well.
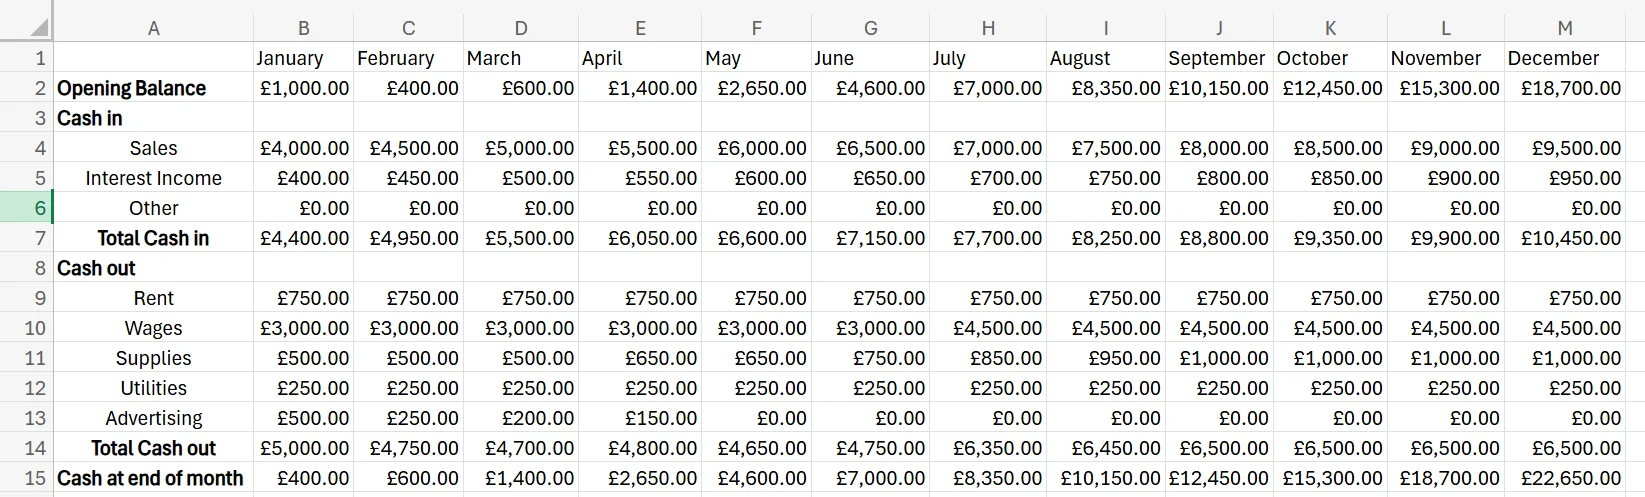
8. Your template is done and ready, and you can now add your business's numbers to quickly and easily forecast your cash flow. Some columns may be consistent from month to month and might be numbers you already know (such as your rent or wages), while others may change and/or require some forecasting based on historical data and your projections/trends (such as your utilities or sales).
Make sure to test the calculations manually at least once to ensure all of your formulas are correct. The screenshot below is an example of what your cash flow forecast may look like once you’ve added all of your data and projections.
9. If you want, feel free to add colours and other types of customisation to help the forecast be easier to follow and understand.
Tips and Tricks for Optimising Your Cash Flow Forecast
If you want to take your Excel cash flow forecast template to the next level, keep these optimisation tips and tricks in mind.
Be Realistic With Forecasts
To ensure your forecast is as helpful and accurate as possible, make sure the numbers you enter are realistic. If you regularly sell around $10,000 of product a month, it wouldn’t make sense to forecast a jump up to $50,000 a month with no reason.
It may “look” better, but it isn’t helpful and actually may end up doing more harm than good. Accurate forecasting isn’t easy, but by consulting past sales and financial data, market and economic trends, seasonality, competitor activity, and considering your upcoming sales pipeline, you can give it your best shot.
Also, consider various scenarios. For example, many businesses may create both a “best-case scenario” and a “worst-case scenario” forecast to ensure they’re prepared for any sort of potential outcome.
Customise and Design it Well
A plain cash flow forecast may be uninspiring, difficult to follow, and hard to stay engaged with. Every line looking the exact same may also lead to confusion and costly mistakes. Instead, consider adding some customisation to help it be more visually appealing.
This may be some strategic bold text, using colour-coded sections, and potentially even including charts or graphs. All of these help the forecast be easier to follow and make it more interesting to look at and read.
Review and Adjust Over Time
Your cash flow forecast should be dynamic and adapt over time as your business finances grow and change. If you forget to adjust the numbers in the template as you go, the forecasts you end up with may be wildly inaccurate.
As things change within your business, whether it be higher wage expenses due to hiring new staff or buying new equipment that you need to pay off over time, make sure to reflect those changes in the spreadsheet.
Contact us today to find out more about how we can help you grow your business!
Related Articles
 Tips & Tricks
Comprehensive Guide on the Formula for VAT in Excel
The article explains how businesses can quickly calculate value-added tax in Microsoft Excel using the formula
=Net*(1+VAT), where the VAT rate is set with an absolute cell reference for accuracy. It walks through setting up columns for net sales, VAT rate, and gross sales; entering the formula; copying it down multiple rows; and double-checking results. Automating VAT this way streamlines invoicing, enhances financial reporting, and minimizes manual errors. Tips & Tricks
Can you Calculate Variance Using Excel?
In this guide, we explain variance as a measure of how widely data points deviate from the mean and shows why understanding this spread is useful for deeper insight and risk assessment. It walks readers through calculating variance in Excel, distinguishing between the VAR.S function for a sample and VAR.P for an entire population, then demonstrates each with a car-sales case study.
 Tips & Tricks
Leveraging Excel Compound Interest Formulas for Business Financial Forecasting
Learn how to harness Excel’s compound interest formulas to build powerful financial forecasting models for your business. This guide covers practical applications like investment growth, ROI projections, and cash flow planning, with step-by-step instructions, advanced Excel tips, and real-world case studies to sharpen your forecasting strategy.
