- TIPS & TRICKS/
- How to Calculate % Change in Excel/

How to Calculate % Change in Excel
- TIPS & TRICKS/
- How to Calculate % Change in Excel/
How to Calculate % Change in Excel
Understanding how to calculate percentage change in Excel is a fundamental skill for anyone working with data. Whether you're tracking revenue growth, monitoring budget fluctuations, or analysing trends over time, this simple formula can reveal meaningful insights at a glance.
In this guide, we’ll walk through the standard method for calculating percentage change, step by step. You’ll learn how to apply the formula, format the results correctly, and use it across multiple rows of data. We’ll also explore how this calculation can support decision-making in finance, sales, and operations—plus answer some of the most common Excel-related questions.
Interested to learn more about Excel? Check our dedicated instructor-led training courses!
How to Calculate % Change in Excel Step by Step
Calculating percentage change in Excel revolves around a single, elegant formula: =(New Value – Old Value)/Old Value. It’s the foundation for measuring growth, decline, or stability between two data points.
Input Your Data
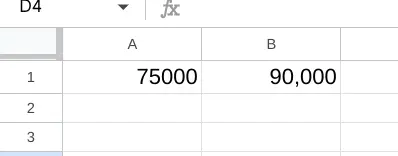
Begin by entering your values into Excel. Suppose you’re a small business owner tracking annual revenue. Place your old value; say, £75,000 from 2023—in cell A1, and your new value—£90,000 from 2024—in cell B1. Clear labelling keeps your spreadsheet organised and reduces errors. See the screenshot below for an example setup.
Apply the Formula
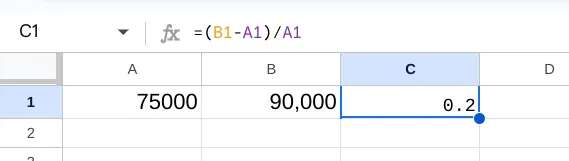
Move to cell C1 and type =(B1-A1)/A1. Hit Enter, and Excel performs the calculation: (£90,000 – £75,000) / £75,000 = 0.2. This raw result represents a 20% increase, but it’s not yet formatted for easy reading. Here’s how it looks initially.
Format as Percentage
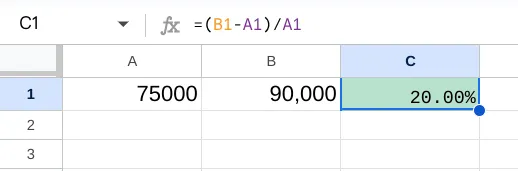
To make it intuitive, right-click cell C1, select “Format Cells,” then choose “Percentage” under the “Number” tab. Set decimal places to zero for simplicity (20%) or two for precision (20.00%). Click OK, and the cell updates. This step transforms a decimal into a percentage your audience can grasp instantly.
Extend with Fill Handle
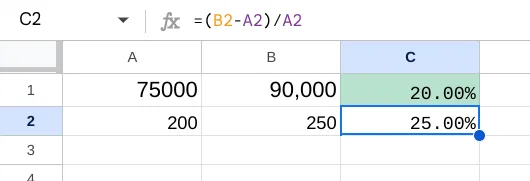
Working with multiple rows? Excel’s fill handle saves time. If A2 has last month’s sales (200 units) and B2 has this month’s (250 units), apply =(B2-A2)/A2 in C2 for 0.25 (25%). Click the tiny square at C2’s bottom-right and drag down to copy the formula across your dataset; perfect for analysing trends over weeks or years. See it in action.
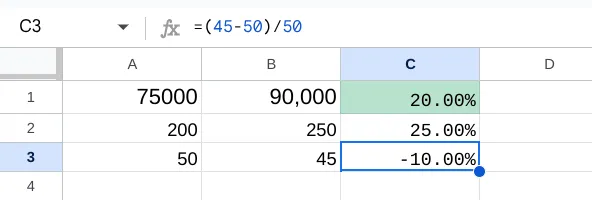
Handle Variations
The formula adapts to diverse scenarios. For a non-profit tracking volunteer hours (50 last quarter, 45 this quarter), =(45-50)/50 in C3 yields -0.1, or -10% after formatting; a decline made visible. Add real-world context like revenue or sales data, and you’ve got a tool for any numeric shift. Here’s a negative change example.
Pro Tips: Avoid division-by-zero errors by ensuring old values aren’t zero; use an IF statement like =IF(A1=0,"N/A",(B1-A1)/A1) if needed. For large datasets, freeze panes (View > Freeze Panes) to keep headers visible while scrolling. These tweaks make your work efficient and polished.
Potential Business Applications
Percentage change in Excel isn’t just a technical trick; it’s a lens for understanding performance across sectors. Here’s how it applies broadly, with examples to spark ideas for your own work.
Financial Analysis
A retailer might calculate a 12% sales increase from Q1 (£200,000) to Q2 (£224,000), revealing seasonal trends or marketing wins. This helps forecast inventory needs or adjust pricing strategies without tying to one industry.
Sales Performance Tracking
Imagine a consultancy tracking client hours; 100 in January, 115 in February. A 15% uptick (=(115-100)/100) signals growth, prompting resource planning or staff training to sustain momentum.
Budgeting and Planning
A non-profit sees donations drop from £10,000 to £9,500 year-over-year (=(9500-10000)/10000 = -5%). This flags a need to rethink fundraising or cut costs, a universal challenge for resource-strapped teams
Monitoring Trends
Government analysts might track service usage; say, library visits rising from 1,000 to 1,050 monthly (=(1050-1000)/1000 = 5%). Small shifts like this inform policy or staffing decisions over time.
Whether you’re comparing annual revenue, assessing programme impact, or spotting operational shifts, percentage change turns raw data into actionable stories. Curious about deeper applications? Contact us to see how we can help you grow your business!
Frequently Asked Questions (FAQ)
Prompting, verification, workflow design, automation, and responsible AI use.
No. These skills apply across functions, from admin and marketing to finance and operations.
Clear examples of how you used AI to save time, improve quality, or support better decisions.
Begin with your current tasks, test AI on repeat work, and track the results.
Related Articles
 Tips & Tricks
Can you Calculate Variance Using Excel?
In this guide, we explain variance as a measure of how widely data points deviate from the mean and shows why understanding this spread is useful for deeper insight and risk assessment. It walks readers through calculating variance in Excel, distinguishing between the VAR.S function for a sample and VAR.P for an entire population, then demonstrates each with a car-sales case study.
 Tips & Tricks
Data Cleaning in Excel Best Practices & Tips
In this guide, we explore how dirty data—duplicates, inconsistencies, misspellings, extra spaces, and more—undermines analysis and decision-making, making data cleaning a vital first step in Excel. It walks through practical tools like Remove Duplicates, the TRIM function for stray spaces, PROPER/UPPER/LOWER for fixing text case, and Find & Replace for standardising values.
 Tips & Tricks
How to Use Excel Lookup with Multiple Criteria
This blog explains how Excel’s LOOKUP functions—particularly XLOOKUP and VLOOKUP—can retrieve data based on multiple criteria. It walks through a step-by-step example of finding an employee’s sales in a specific region, showing both an XLOOKUP formula and a VLOOKUP alternative that uses a helper column.
