- TIPS & TRICKS/
- Advanced Analysis Techniques for Calculating CAGR in Excel/


Advanced Analysis Techniques for Calculating CAGR in Excel
- TIPS & TRICKS/
- Advanced Analysis Techniques for Calculating CAGR in Excel/
Advanced Analysis Techniques for Calculating CAGR in Excel
With 29% of businesses identifying economic uncertainty as the top factor impacting turnover in 2025, optimising corporate forecasting has become essential. Accurate forecasting empowers companies to budget more effectively and confidently plan their growth despite challenging conditions.
CAGR, or Compound Annual Growth Rate, is a widely used metric in forecasting growth trends. However, its focus on a smoothed average return overlooks the need to understand how to effectively apply growth rates in dynamic and rapidly changing business scenarios.
In this article, we will explore calculating CAGR in Excel, as well as advanced CAGR analysis techniques, looking beyond basic calculations to how businesses can leverage it to optimise corporate forecasts.
Explore our Excel courses for more detailed guides and tips on other topics.
Applying CAGR Insights to Investment and Business Strategy
Before diving into the strategies, it's helpful to recall how to calculate CAGR in Excel:

This formula calculates the smoothed annual growth rate a business metric would need to move from its starting value to its ending value over a given period. It's simple yet powerful, offering a clear, comparable view of growth that can guide smarter decision-making across business strategies.
Suppose ABC company's revenue from clothing sales grew from £250k to £350k from 2019 to 2022.

A 3-year CAGR of 11.87% indicates that the business’s sales grew at a constant annual rate of 11.87% from 2019 to 2022. This steady growth rate provides a reliable benchmark for forecasting future revenue and making informed budgeting decisions.
Evaluating Investment Growth
Comparison is important in business and investing. It is how decision-makers know what to double down on or expel to maximise resources. By calculating CAGR in Excel, investors can see how fast an investment grew/is growing within a duration, laying the groundwork for financial projections.
Continuing with the clothing business example, say ABC also invested in real estate in the same period and with the same starting capital. Using CAGR, you can assess which investment performed better.
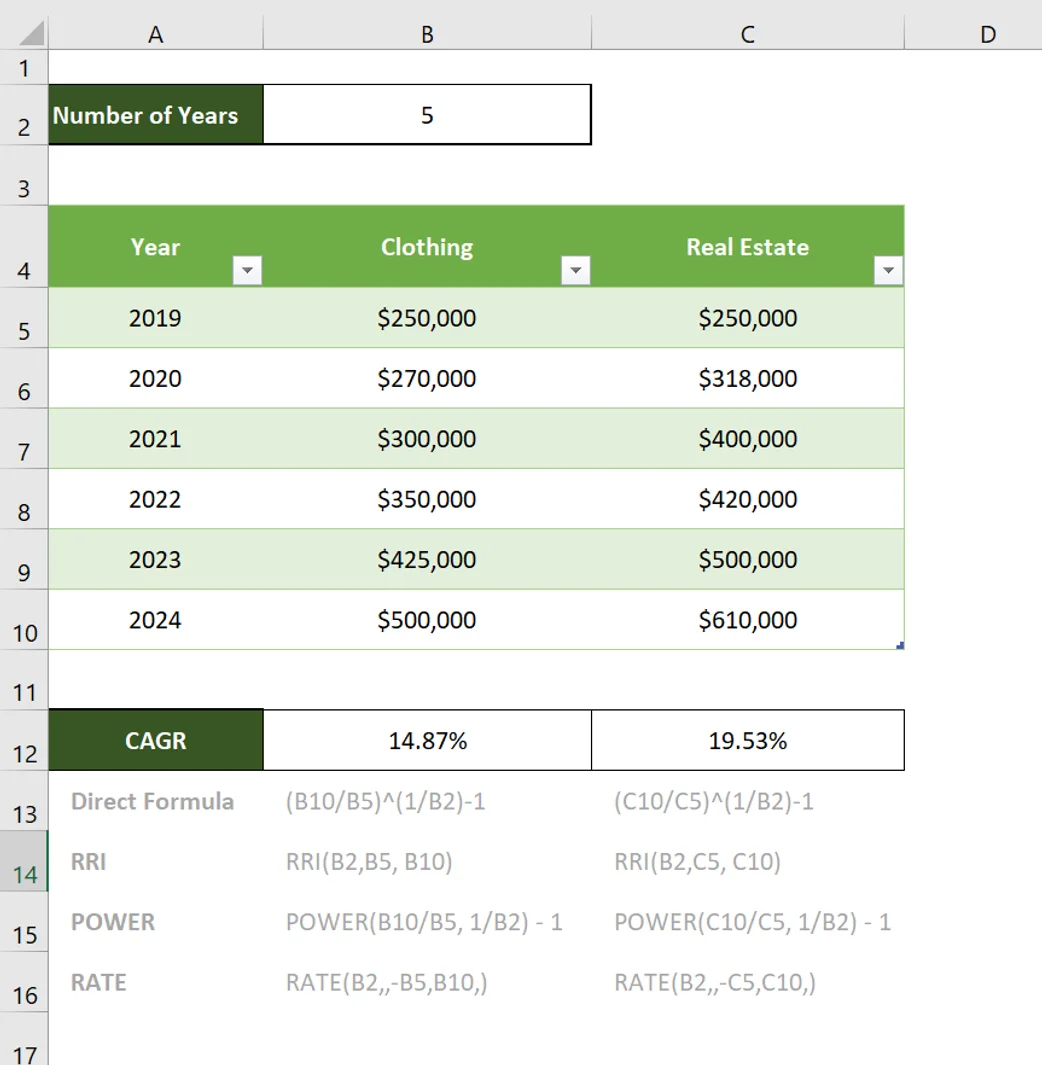
The above results show that the real estate investment had a 5-year CAGR of 19.53%, while the clothing business had a 5-year CAGR of 14.87%. That is, it grew at a slower rate compared to real estate investment. If ABC is looking for higher growth, the comparative analysis of CAGR shows which to choose.
Note: “Good” or “bad” CAGR is based on the investment’s fundamentals, industry benchmarks, and other externalities.
Forecasting Revenue Growth
Businesses are built forward but understood backwards. That means history plays an important role in planning for the future. Budgeting is a key part of financial planning, and CAGR helps companies adjust their income statements and balance sheets accordingly.
Using ABC historical data, we can project a 6-year revenue using the 5-year CAGR in Excel. First, we calculate the overall CAGR of total revenue.
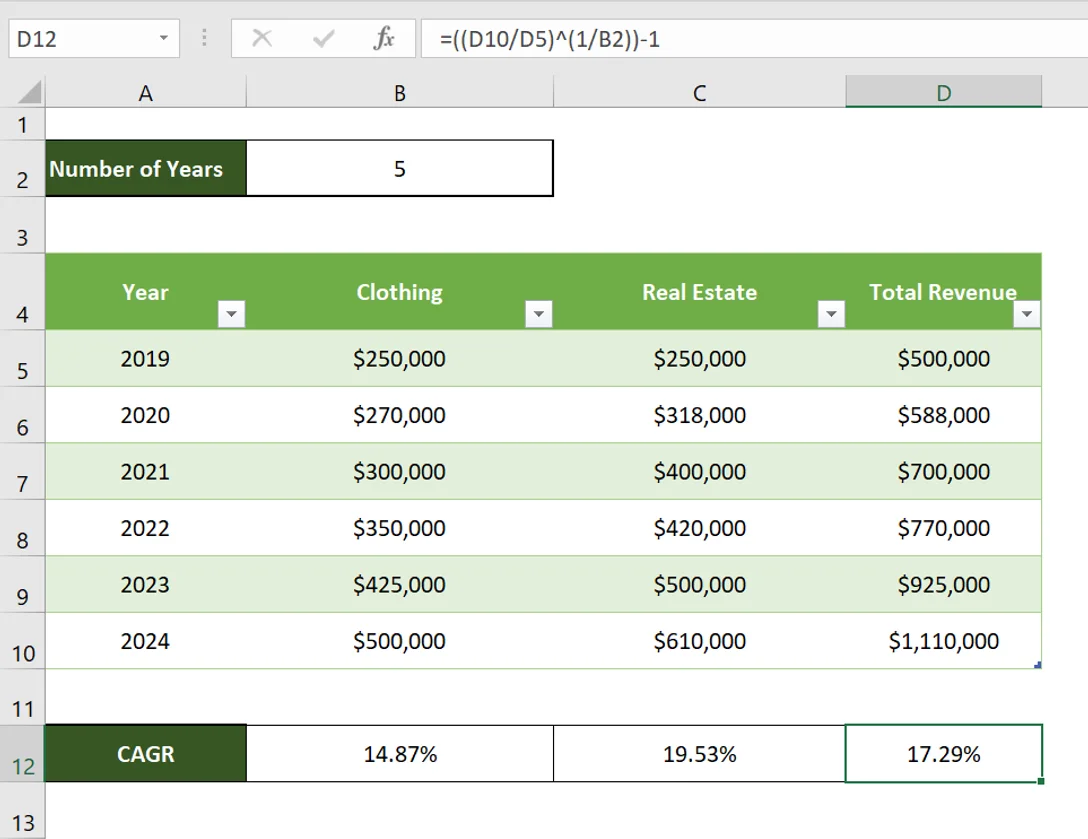
The result means ABC’s revenue has grown at a smoothed average annual rate of 17.29%. To forecast the company’s revenue for the next 6 years, we will be using a derived CAGR formula expressed as:

At the current rate, the revenue by 2030:

We can apply the future value formula for the years between 2025 and 2030:
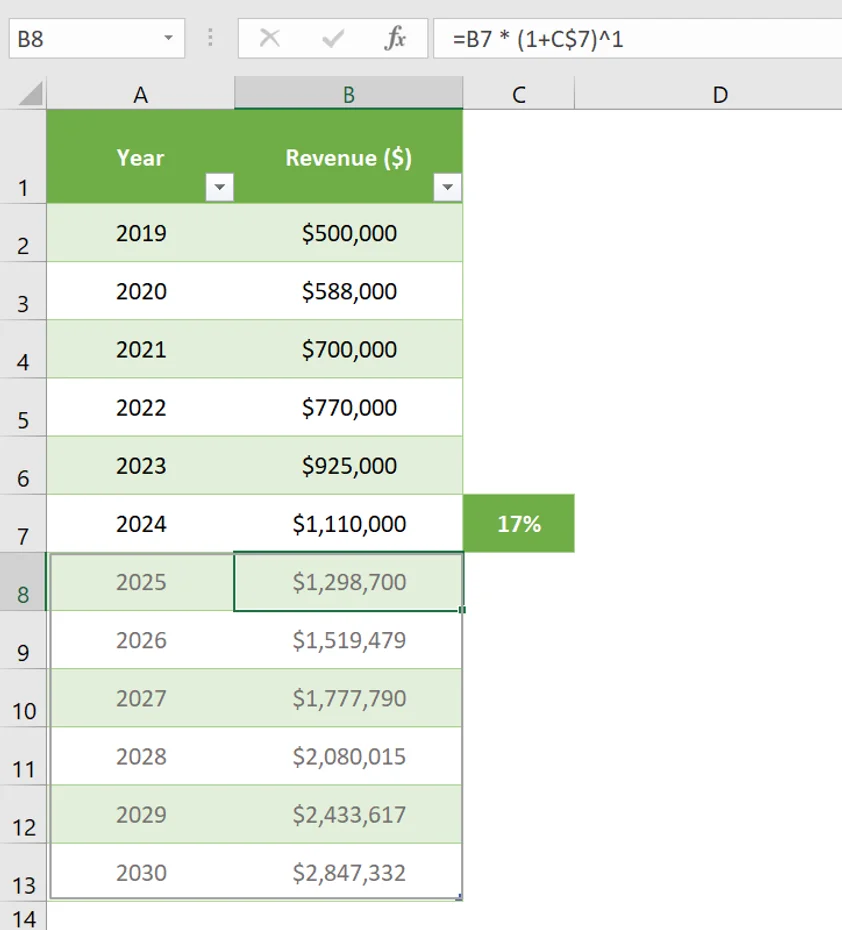
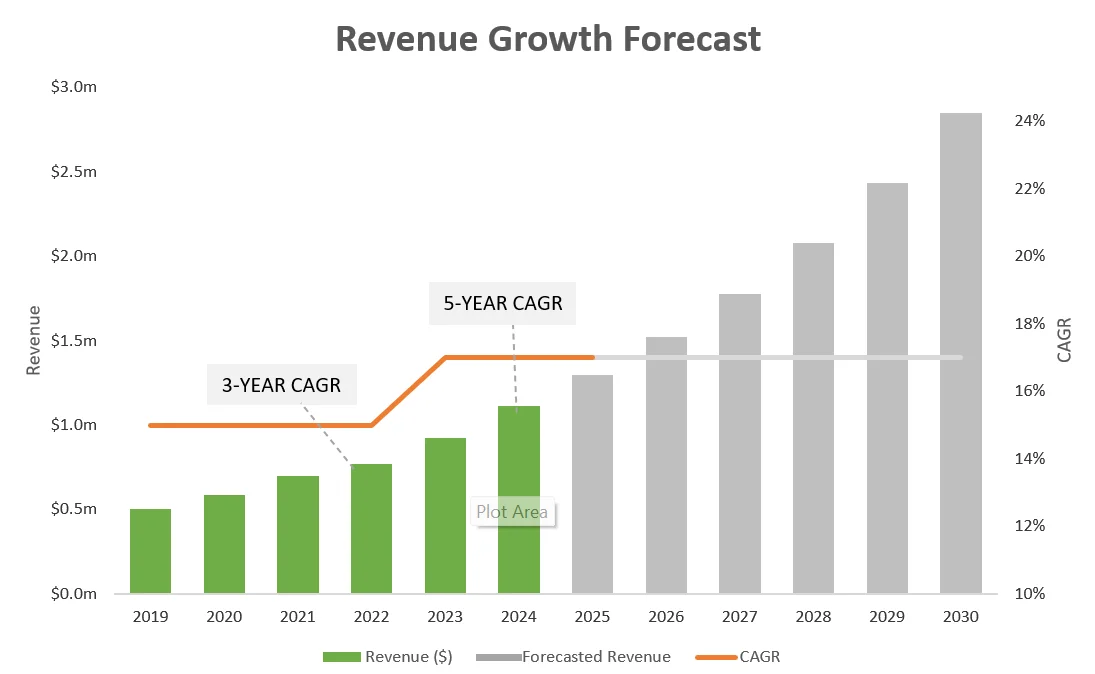
The future values assume a constant rate of return of 17%. If ABC grew at a compound annual growth rate of 17% over the last 5 years, we can assume the same rate continues and, therefore, project future growth using that rate. A clustered column chart can be used to present the future revenue projection to stakeholders.
However, this only holds if the same growth conditions persist, despite external or internal factors. To test growth scenarios and plan for risks, ABC can calculate CAGR to model different scenarios. For example:
- Aggressive scenario: 20%
- Base case scenario: 17%
- Conservative scenario: 15%
This helps businesses to be better prepared for different outcomes.
Corporate Training and Implementation
Excel is globally used as a tool for financial modelling, yet many finance teams don’t yet maximise its full potential. A rising trend among companies trying to fix this is customised corporate training programs that meet employee needs. This way, companies can reduce manual errors, make strategic decisions, and improve their forecasting accuracy.
Well-trained finance teams drive profitability and give companies a competitive edge in a data-driven landscape. That’s why Future Savvy offers customised training programs, such as Microsoft Excel Training Courses for Intermediate, that empower finance teams to build dynamic finance models, confidently analyse growth trends, and automate complex calculations.
The ever-changing business landscape has necessitated the need for finance teams to go beyond basic understandings to advanced applications of analytic metrics and tools in providing accurate forecasts and strategic insights for business growth.
Conclusion
CAGR is not just another metric; it is vital in providing insights into business growth and informing business decisions. Gaining mastery over calculating CAGR and advanced analysis in Excel sets the finance team apart to compete at the highest level, forecast growth more accurately, and make better finance decisions.
If you are looking to transform your company’s forecasting and business analysis, then Future Savvy’s instructor-led training program is what you need to transform Excel skills into business impact. Begin your journey with us here.
Related Articles
 Tips & Tricks
How to Calculate CAGR Growth in Excel
In this article, we look at how compound annual growth rate (CAGR) as the “average speed” at which an investment or business metric grows over time, smoothing out year-to-year volatility. It walks through the manual CAGR formula— (Ending Value / Beginning Value)^(1/Years) − 1 —then demonstrates four Excel-based methods to automate the calculation: the direct formula, RRI, POWER, and RATE functions.
