- TIPS & TRICKS/
- How to Calculate CAGR Growth in Excel/


How to Calculate CAGR Growth in Excel
- TIPS & TRICKS/
- How to Calculate CAGR Growth in Excel/
How to Calculate CAGR Growth in Excel
There’s a popular saying that what you can’t track, you can’t improve on. In the world of business, finance, and investment analysis, growth rate is never a straight line. It is a mix of many ups and downs.
This is where CAGR, or compound annual growth rate, comes in. It smooths out the ups and downs and gives companies or investors a clearer picture of the average annual growth rate over a period.
CAGR plays a vital role in measuring and comparing growth in a simple and easily understood way. This article will show you how to calculate CAGR growth in Excel. For more tips and practical advice, make sure to check our dedicated Excel courses.
Download our Excel Formulas Cheat Sheet
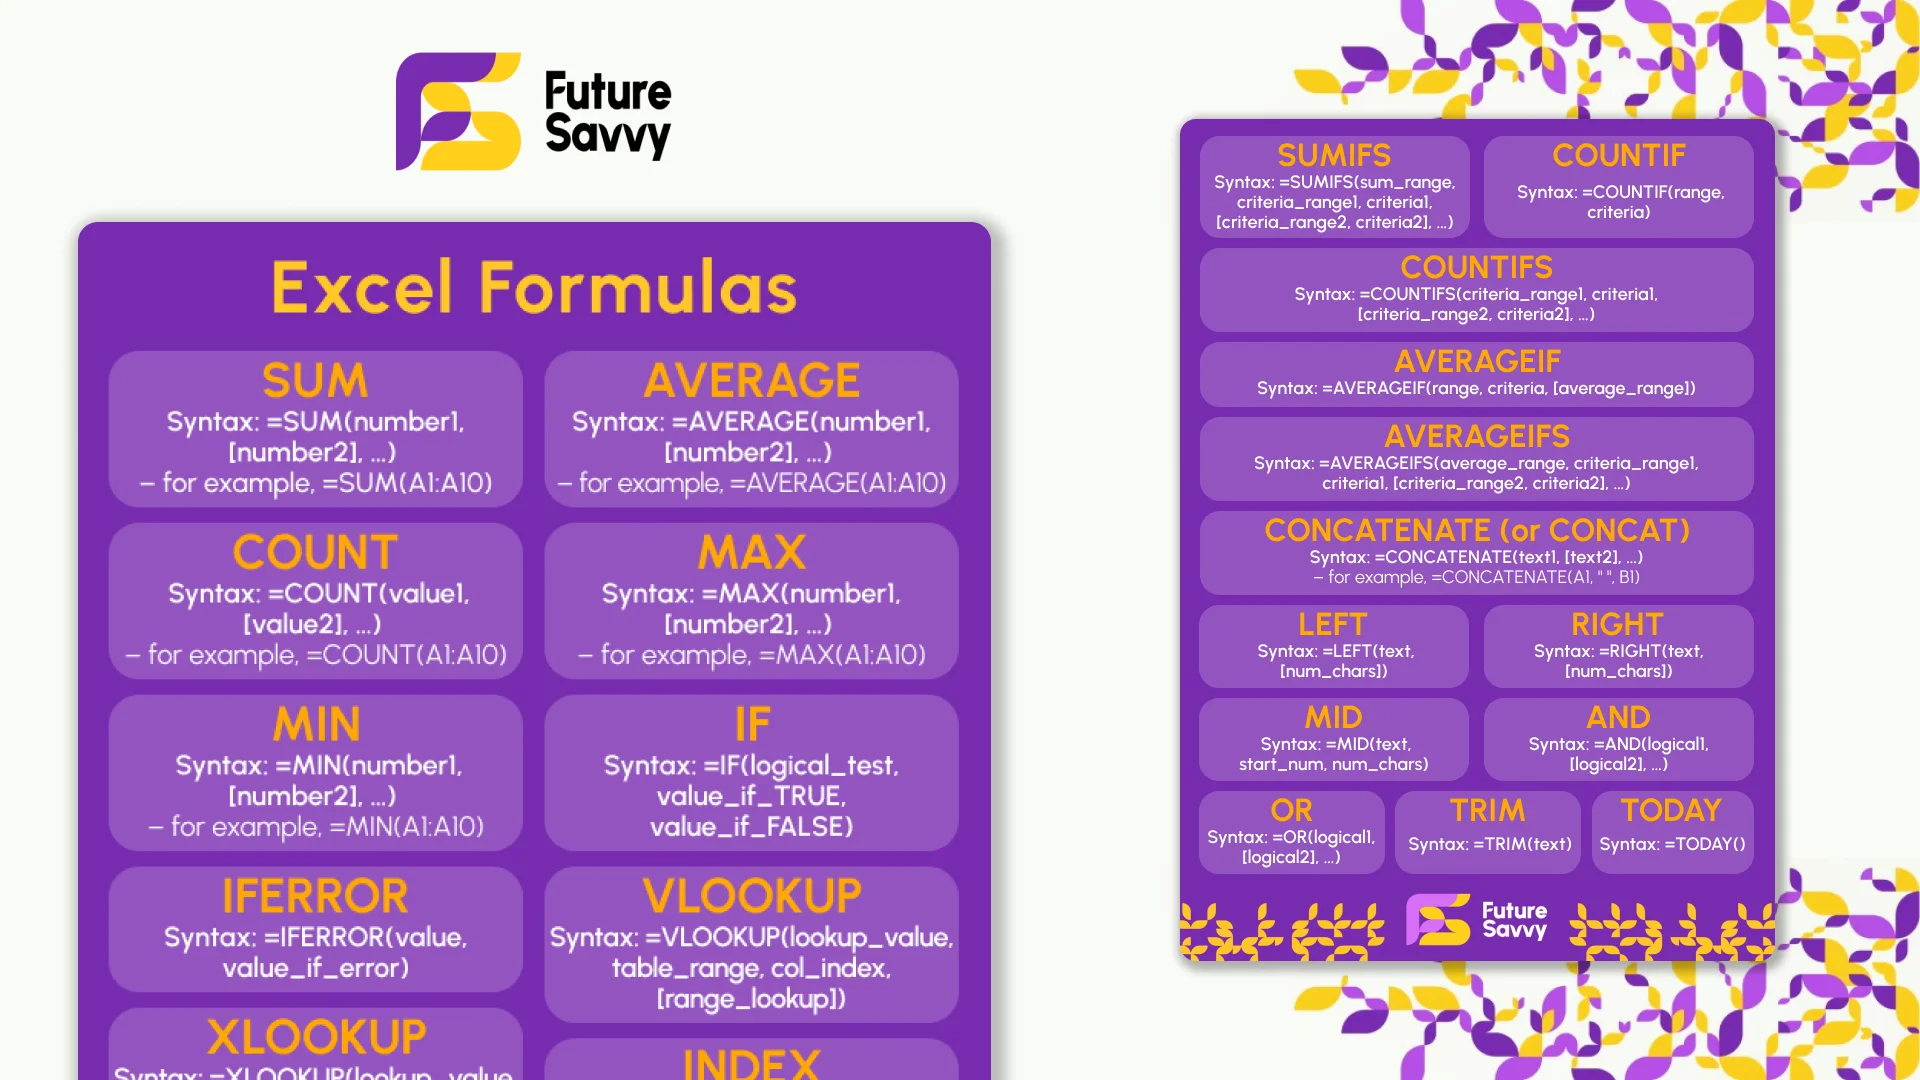 Download now
Understanding CAGR
Let’s say you travelled from town A to town B, which took 4 hours. Along the way, you encountered roadblocks and speed bumps that briefly slowed you down, and you might have taken quick snack breaks. If I asked you at the end of the trip, “What was your average speed?”
Without telling me about all the times you slowed down or sped up, you'll most likely say, "I averaged 50 kmph.” This is what CAGR does as a performance metric. It shows you the “average rate” at which your investment grew annually over a period.
Unlike other investment return metrics that only provide the total return or the average yearly return, CAGR accounts for the compounding effect over time.
Calculating CAGR in Excel
Three input values are needed to calculate the CAGR: beginning value, ending value, and number of years taken. The formula is expressed as:

For instance, if a company’s revenue grew from $100m to $250m from fiscal year 2020 to fiscal year 2025. To calculate the CAGR manually, we’ll need the following values:
- Ending value = $250m
- Beginning value = $100m
- Number of years = 2025 - 2020 = 5
Note: The number of years doesn’t include the start year.
Then we plug into the formula to get:

The 5-year CAGR is 20.11%. That is, the company’s revenue grew at a smoothed rate of 20.11% annually over the last 5 years.
Learn more about the business applications of CAGR calculations in Excel in our dedicated guide (Advanced Techniques).
Download our Excel Skills Self-Assessment Questionnaire
 Download now
CAGR in Excel: Tips & Tricks
If calculating CAGR manually is time-consuming, Excel offers simpler ways. It’s worth noting that Excel doesn’t have a "CAGR" function yet, but you can calculate the Compound Annual Growth Rate using alternative functions.
Here are four methods you can use to calculate CAGR in Excel.
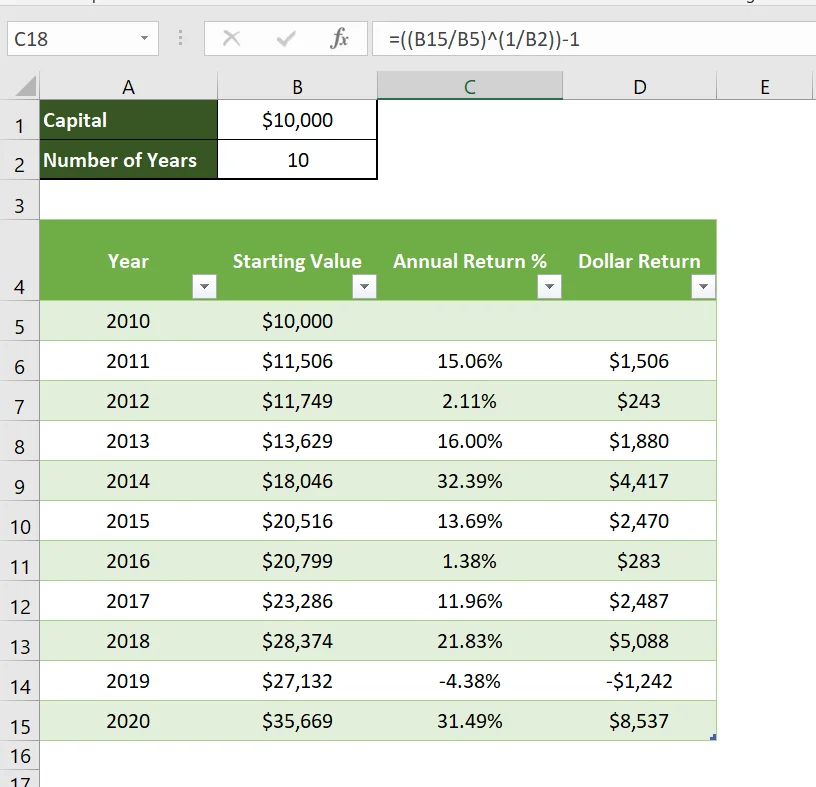
1. Direct CAGR Calculation
Let’s use the example below and see how to apply it in an Excel workbook.
If David invested $10,000 in the S&P 500, and the value rose to over $35,000 in a 10-year period, we will use the following formula to calculate the CAGR.

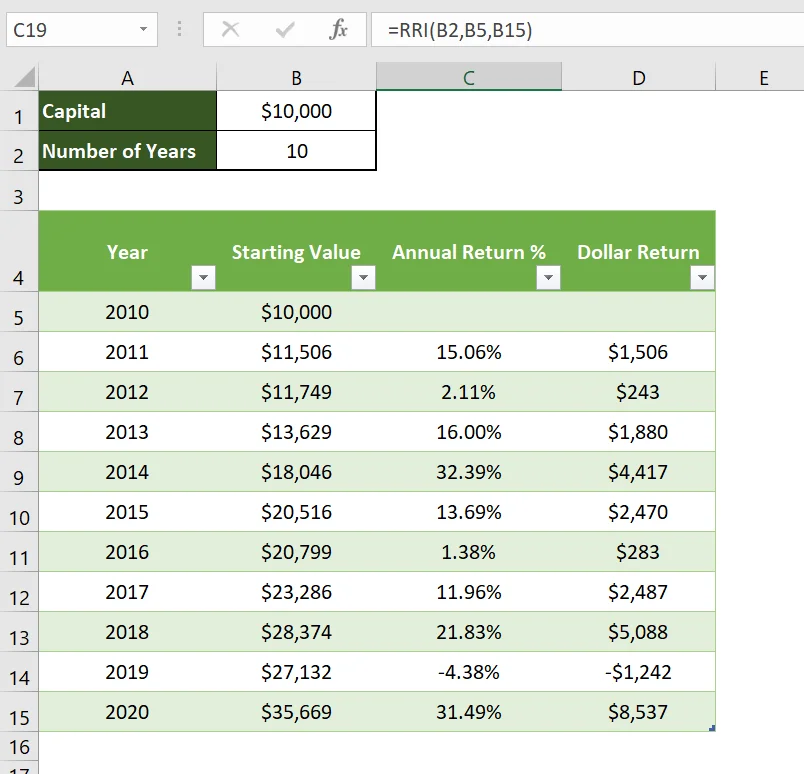
2. Using the RRI Function in Excel
The RRI function in Excel is a popular alternative for calculating CAGR. It shows the interest rate at which an investment grows from its beginning value to its ending value. Its syntax is as follows:

Using the same example, we have the output below in Excel.
3. Using the POWER Function in Excel
The POWER function removes the need to compute the exponential value manually. This makes it easier than the direct CAGR formula.
The syntax for the POWER function is:

To calculate CAGR using the POWER function, we will replace “number” with “EV/BV” and “power” with “1/n”.
You will notice we’ve used up the syntax, and “-1” is missing. For the POWER function, we subtract “1” from the results separately. So we have,

Using the POWER function, let’s calculate the 10-year CAGR for David’s investment of $10,000.

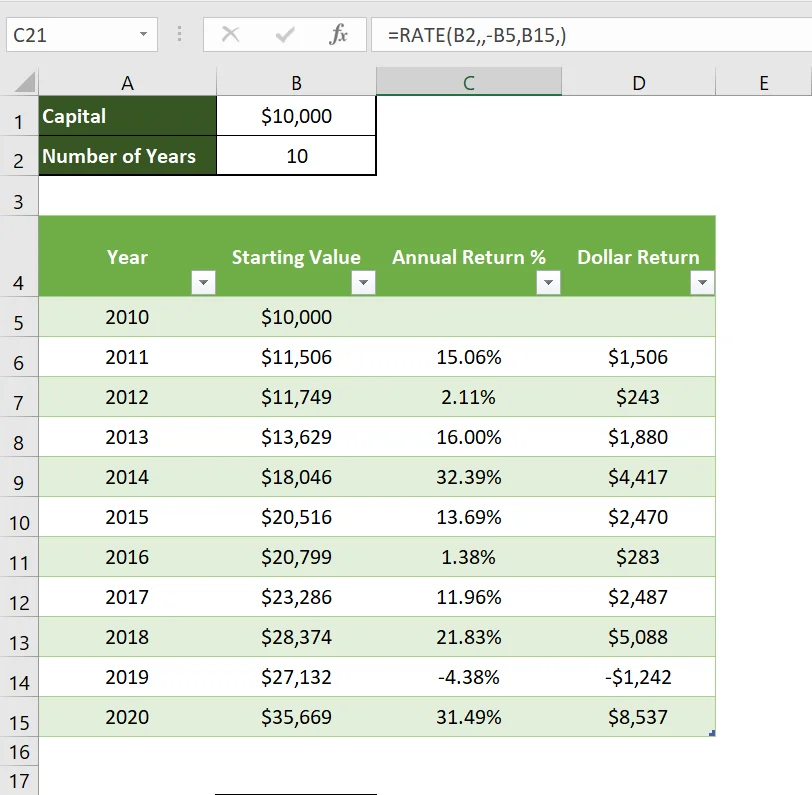
4. Using the RATE Function in Excel
The RATE function is used to determine interest rates but can also be used to calculate CAGR. Because of the additional parameters, it is preferred to the POWER and RRI functions if making financial projections are involved.
The syntax for the RATE function is:

Where:
- Nper = total number of periods (or years in CAGR calculation)
- Pmt = payment per period (often left empty for CAGR since there are no recurring payments)
- Pv = present value (which is the beginning value entered as a negative number)
- Fv = future value (ending value in CAGR)
- [type] = specifies if there are any due payments at the beginning (1) or end (0) of the investment period.
- [guess] = estimated rate of return. Its value is often assumed as 0.1 (10%).
Note that “type” and “guess” values are optional and are not needed to calculate CAGR.
To calculate CAGR, we will replace:
- “nper” with “n”
- “pv” with “-BV”
- “fv” with “Ev”
Remember to add negative to the beginning value, else the formula will return a !NUM Error.
Get in touch to learn more about Future Savvy’s instructor-led training program and how we can help you grow your business.
Frequently Asked Questions (FAQ)
Prompting, verification, workflow design, automation, and responsible AI use.
No. These skills apply across functions, from admin and marketing to finance and operations.
Clear examples of how you used AI to save time, improve quality, or support better decisions.
Begin with your current tasks, test AI on repeat work, and track the results.
Related Articles
 Tips & Tricks
Can you Calculate Variance Using Excel?
In this guide, we explain variance as a measure of how widely data points deviate from the mean and shows why understanding this spread is useful for deeper insight and risk assessment. It walks readers through calculating variance in Excel, distinguishing between the VAR.S function for a sample and VAR.P for an entire population, then demonstrates each with a car-sales case study.
 Tips & Tricks
How to Use Excel Lookup with Multiple Criteria
This blog explains how Excel’s LOOKUP functions—particularly XLOOKUP and VLOOKUP—can retrieve data based on multiple criteria. It walks through a step-by-step example of finding an employee’s sales in a specific region, showing both an XLOOKUP formula and a VLOOKUP alternative that uses a helper column.
- Tips & Tricks
Excel Skills Self-Assessment Questionnaire
This free, printable Excel Skills Self-Assessment helps you quickly gauge your level and pick the right next step in your learning path. It contains 15 multiple-choice questions spanning navigation, formulas, lookups, tables, PivotTables, charts, dynamic arrays, Power Query, and more. You’ll score yourself and interpret the result to see whether you’re Beginner, Intermediate, or Advanced - then follow tailored course recommendations based on your score.
