- L&D INSIGHTS/
- Why Staff Turnover in the UK Is Spiking/

Why Staff Turnover in the UK Is Spiking
- L&D INSIGHTS/
- Why Staff Turnover in the UK Is Spiking/
Why Staff Turnover in the UK Is Spiking
For leaders of UK small and medium-sized businesses (SMBs), the challenge of finding the right talent is relentless. The difficulty of hiring in a competitive market is one issue, but the growing rates of staff turnover are putting an additional strain on businesses. With SMBs accounting for 99.8% of the UK's business population, three-fifths of its employment, and half of its turnover, their stability is a matter of national economic health.
The stark reality, as revealed in our latest White Paper, is that high first-year churn is not a matter of chance, but a direct consequence of a specific, addressable business failure: underinvestment in employee skills. However, by strategically investing in employee training, SMBs can turn this critical liability into a powerful lever for retention, productivity, and long-term competitive advantage.
Why First-Year Staff Turnover Spikes
First-year churn refers to employees leaving within their first 12 months on the job. This metric often spikes in frontline and operations roles, where work conditions are tough and growth pathways may seem limited. Younger workers especially expect development opportunities – without them, many won’t stick around.
“40% of employees leave in year one without adequate training – yet 94% would stay longer if development is provided.”
This retention gap is huge, and it hits smaller businesses hardest. Frontline-heavy sectors (e.g. care, hospitality) routinely see first-year attrition near 30–40%, far above the ~18% average staff turnover in small organisations.
Crucially, high churn is expensive: the average cost to replace a single employee is around £30,000 in the UK. That figure factors in recruiting, training a new hire, and lost output while they ramp up. In other words, letting one employee walk out the door can easily cost the equivalent of half their annual salary or more in replacement costs.
Download our White Paper: The Impact of Skills Underinvestment on UK SMBs
 Download now
Retention Math at a Glance
If an SMB has 100 employees and a 40% first-year attrition rate, that’s 40 leavers per year. At ~£30k in replacement cost each, turnover could be draining £1.2 million annually. Just a modest improvement - say from 60% to 70% one-year retention – would avoid 10 exits, saving roughly £300,000 a year in direct costs (not to mention the productivity benefits of keeping experienced staff).
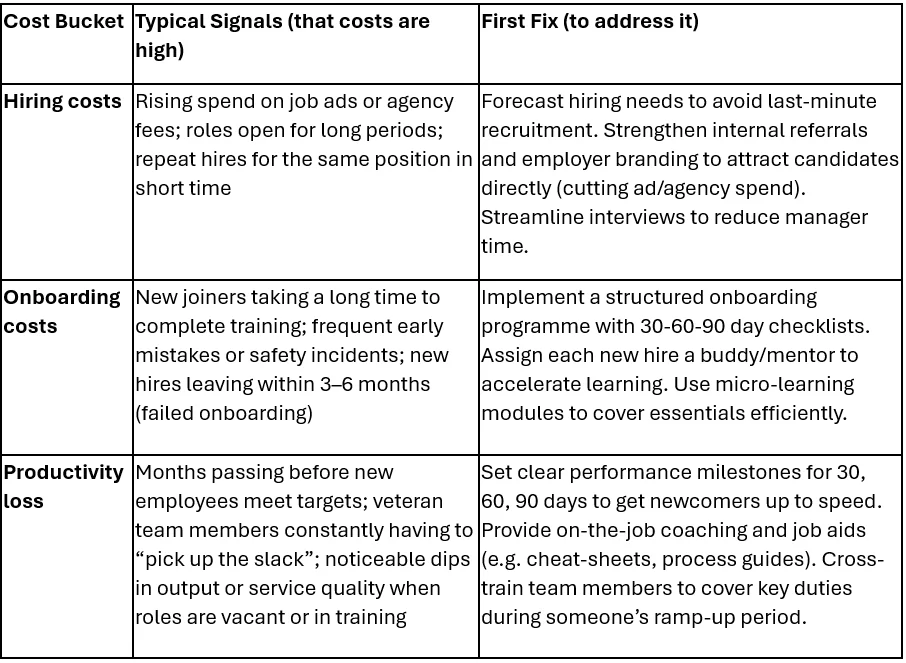
The Hidden Costs of Staff Turnover
Why does losing an employee cost so much? Because the expense isn’t just in hiring a replacement – it’s a combination of multiple factors that quickly add up. Broadly, the cost per leaver comes from three buckets:
- Hiring cost: Job advertising fees, recruitment agency commissions, and the hours managers spend reviewing CVs and interviewing candidates (multiplied by their hourly “loaded” rate).
- Onboarding cost: Training time (both the new hire’s time and the trainer/manager’s time) paid at salary, plus any training materials, course fees, or software licenses for onboarding.
- Productivity loss: The new hire isn’t fully productive on Day 1. It might take weeks or months before they reach the output of the departed employee. During that ramp-up period, the business is effectively losing output or sales. One study found it takes about 28 weeks for a worker to hit optimal productivity, resulting in ~£25k of lost output on average – by far the biggest component of turnover cost.
Other Costs Related to Staff Turnover
- Operational errors & inefficiency: Poor skills create costly mistakes - e.g., aUK gov bidding Excel error cost £40M. For SMBs, a single misconfigured formula or data entry error can cascade into bad reports and broken client trust.
- Wasted tech & a vicious cycle: Over half of leaders say teams underuse tools; training unlocks ROI- firms that invest see +24% profit margins.
How to Do Your Own Math
When we put it all together, the total cost per leaver = Hiring + Onboarding + Productivity loss. For transparency,here’s how you can quantify each piece:
- Hiring cost = advertising + recruitment fees + (manager interview hours × avg. loaded hourly rate)
- Onboarding cost = (training hours × avg. loaded rate) + training materials/licenses
- Productivity loss = ramp_days × daily contribution gap (the value lost each day until full productivity)
- Total cost per leaver = Hiring cost + Onboarding cost + Productivity loss
In practice, the exact totals will vary. For example, a “low” scenario (minimal hiring spend, quick ramp-up) might be on the order of £5k–£10k per exit. A typical scenario for a mid-level role easily runs around £25k (e.g. moderate agency fees, ~2 months of reduced output).
And a high-cost scenario (specialist role, recruiter used, long training period) can exceed £40k to replace one person. Every pound spent here is a pound off your profit. In fact, saving £30k in staff turnover cost has the same impact as generating £300k in new revenue (assuming a 10% profit margin). It’s clear that retention delivers a direct ROI.
To see the potential savings for your organisation, try plugging in your own numbers:
Assumptions:
avg_loaded_rate = £___/hour; ramp_days = ___; headcount = ___; hires_per_year = ___
total_cost_per_leaver = hiring_cost + onboarding_cost + (ramp_days × daily_contribution_gap)
annual_savings = (baseline_churn − improved_churn) × headcount × total_cost_per_leaver
(In the above calculator, “baseline_churn” is your current annual turnover rate and “improved_churn” is your target after interventions. For example, reducing churn from 30% to 20% at a 100-person company would mean ~10 fewer leavers, yielding annual_savings of 10 × total_cost_per_leaver.)
If you want to learn more about generating valuable insights from your data, make sure to download the full White Paper.
Learning Paths That Retain: A 90-Day Blueprint for Frontline & Ops Staff
Reversing negative staff turnover trends requires a structured onboarding and development plan that engages new hires from day one. A 30-60-90 day plan provides a clear roadmap, helping employees become productive faster and feel connected to the organisation.
Days 1–30: Foundation and Integration
The first month is about building a solid foundation. The focus is on learning, not just performing.
- Essentials: Complete all necessary HR paperwork and compliance training. Provide a thorough overview of the company's mission, values, and culture.
- Role Clarity: Clearly define the role, responsibilities, and key performance indicators (KPIs). Introduce the essential tools, software, and processes they will use daily.
- Connection: Assign a buddy or mentor for informal support. Schedule introductory meetings with key team members and stakeholders to build relationships and understand team dynamics.
H3: Days 31–60: Contribution and Mastery
The second month shifts from learning to doing. New hires begin to apply their knowledge and take on more responsibility, which is crucial for reducing staff turnover.
- Task Mastery: Start working on core projects with decreasing supervision. Use scenario-based training to practice handling common operational challenges in a safe environment.
- Feedback Loop: Schedule weekly check-ins with their manager to discuss progress, ask questions, and receive constructive feedback.
- Workflow Tools: Deepen proficiency with job-specific software and systems, moving from basic use to confident application.
Days 61–90: Independence and Growth
In the final phase, the employee should be operating with greater autonomy and looking toward future development.
- Problem-Solving: Encourage them to take initiative on projects and identify areas for process improvement.
- Cross-Training: Provide opportunities to shadow colleagues in adjacent roles to build a broader understanding of the business.
- Future Focus: Hold a 90-day review to discuss achievements, identify ongoing development needs, and set goals for the next quarter.
A Case in Point: How a UK Hotel Group Cut Early Turnover by 11%
Hand Picked Hotels, a luxury UK hotel group, faced a common challenge: its annual employee retention stood at just 47%. To tackle this, the company launched an experiential training programme called "Being Hand Picked," designed to embed key service behaviours - being attentive, natural, charming, and creative -across its entire workforce.
The programme was delivered through five modules, using interactive methods like games and role-plays, and was led by internal "champions" selected from each hotel. The results were transformative:
- Staff turnover within the first six months of employment fell by 10.79%.
- Overall employee retention increased from 47% to 61%.
- Guest complaints fell by 40%, saving the company an estimated £53,000 a year.
This case demonstrates a clear link between targeted, engaging training and a direct, measurable improvement in both employee retention and business performance.
KPIs for a Stable Workforce
To justify investment in training, leaders need to see a clear return. By tracking the right Key Performance Indicators (KPIs), you can transform upskilling from a perceived cost into a measurable driver of business value.
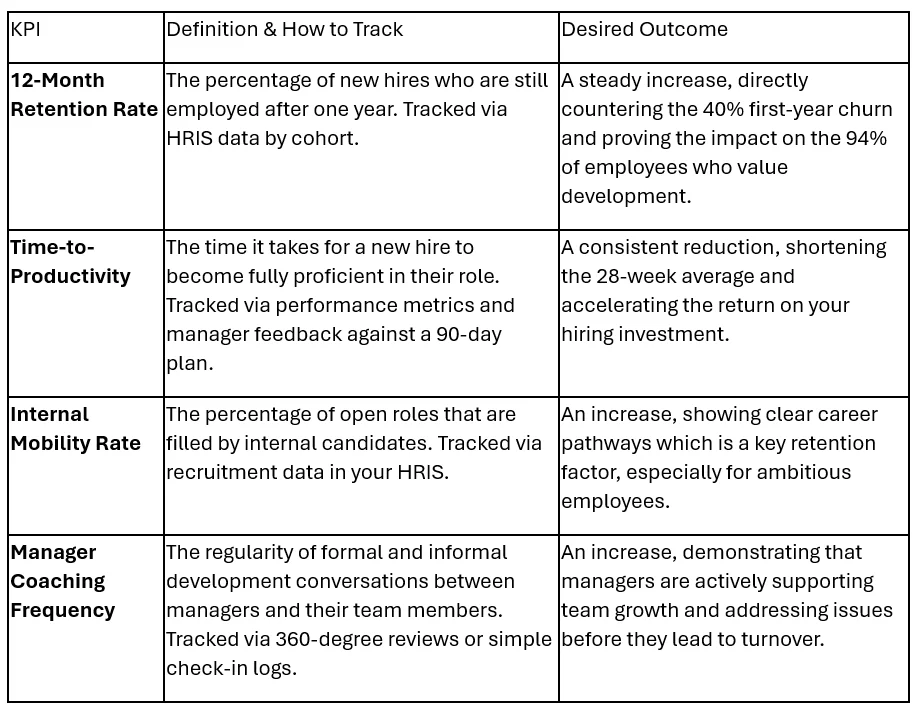
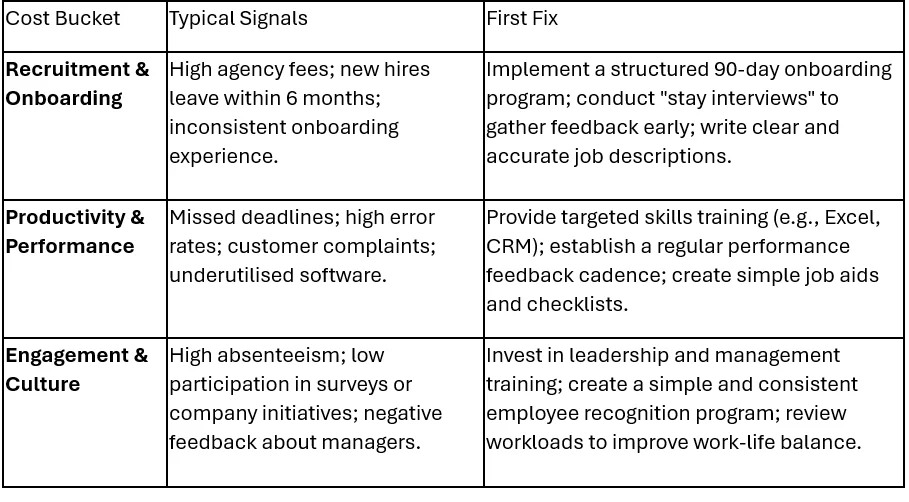
Remember that high staff turnover doesn't happen in a vacuum. It is preceded by clear warning signs. Use can also refer to this guide to identify common signals and implement the right fixes before valuable employees start looking for the exit.
Year-one staff turnover may be spiking, but as we’ve shown, it’s a challenge you can counter. By treating training as a core strategy rather than an afterthought, UK SMBs can reduce costly churn, accelerate new-hire productivity, and ultimately strengthen their margins. The logic is compelling: invest in your people’s growth, and they are far more likely to stay and contribute, saving you the astronomical costs of constant rehiring.
Ready to dive deeper? For a full data breakdown, ROI calculations, and practical templates by sector, download Future Savvy’s white paper“ The Impact of Skills Underinvestment on UK SMBs” (2025).
It contains all the research behind these numbers – including industry-specific turnover stats and a step-by-step guide to building your own retention-boosting training programme.
Or get in touch today to discuss how you can empower your business to thrive.
Related Articles
 L&D Insights
Digital skills gap: £63bn a year hit for UK SMBs
UK SMBs collectively lose £63bn a year to the digital skills gap - about £3,800 per employee - driven by countless small inefficiencies. The article pinpoints three drains: process inefficiency, errors and rework, and underused software and illustrates gains via a case study where targeted enablement improved billable hours and cut rework. It recommends a pragmatic 90-day plan: audit key workflows, deliver focused training with “digital champions,” then track ROI and bake improvements into SOPs.
 L&D Insights
Literacy vs Digital Literacy: What Are the Differences?
Traditional reading-and-writing literacy has broadened into digital literacy—the ability to locate, evaluate, create, and communicate information safely and effectively through technology. The article traces this evolution from basic “computer literacy” of the 1990s to today’s multifaceted concept that spans information, media, and AI literacy. Digital skills now underpin social inclusion, workforce readiness, and democratic participation, while gaps in access, competence, and support exacerbate inequality.
 L&D Insights
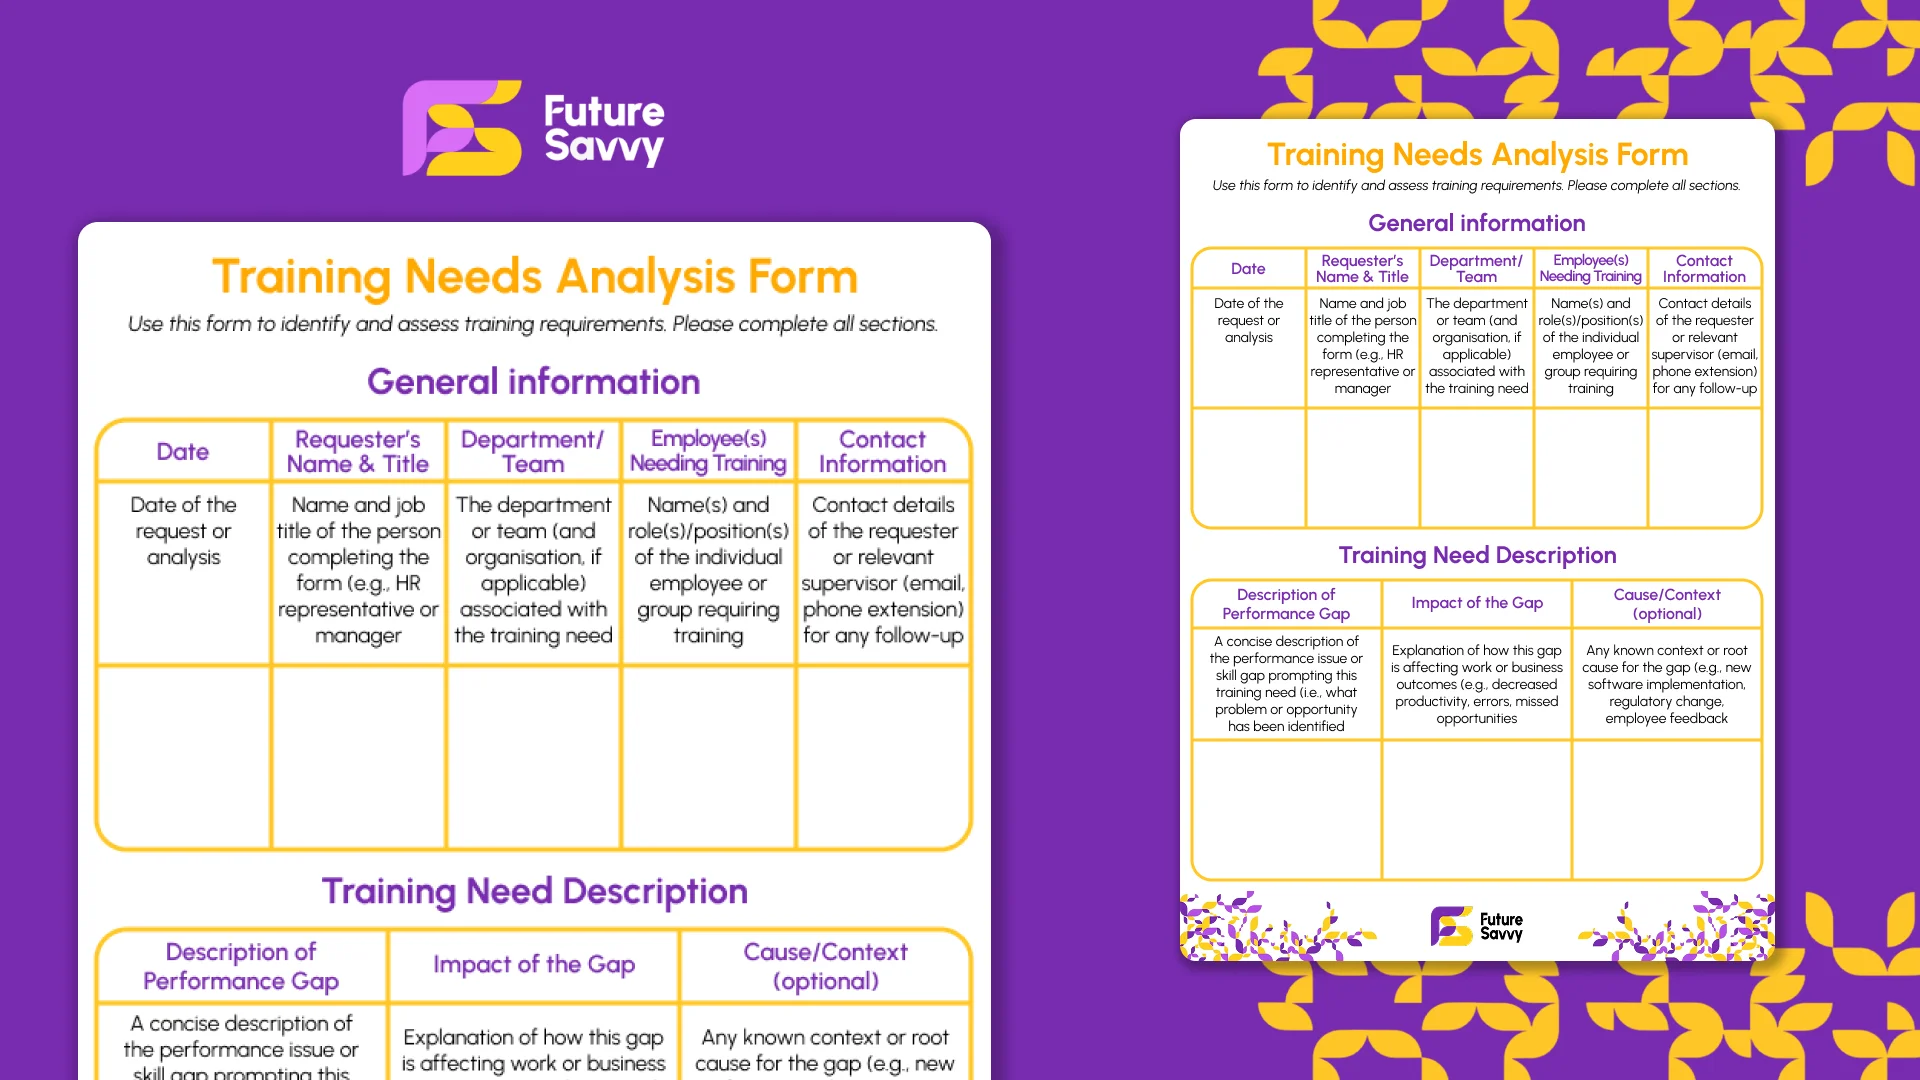
Training Needs Analysis Form
This fillable Training Needs Analysis (TNA) form helps teams identify and assess training requirements while capturing core request details (date, requester, team, employees). It walks you through defining the performance gap and its impact, aligning the need to business goals, comparing current vs. desired skills, and setting clear learning objectives with success criteria. You’ll also specify preferred delivery format/provider, timeline and priority, budget/resources, and define success metrics, evaluation, and approvals - so every request becomes a measurable, accountable plan.
