- TIPS & TRICKS/
- Data Analytics and AI: From Reporting to Predicting/


Data Analytics and AI: From Reporting to Predicting
- TIPS & TRICKS/
- Data Analytics and AI: From Reporting to Predicting/
Data Analytics and AI: From Reporting to Predicting
Most finance and analytics teams are still buried in static reports and month‑end packs. Days are spent reconciling figures, refreshing dashboards, and answering the same backward‑looking questions: what happened, where did we miss budget, which cost centre moved? Yet the questions that really matter are forward‑looking: what is likely to happen next, what if conditions change, and what should we do about it now?
Modern data analytics and AI can bridge that gap. Instead of just describing the past, they can forecast trends and risks, surface the drivers behind anomalies, and recommend next actions directly inside tools you already use -ERP and EPM platforms, BI dashboards, Excel, and Microsoft 365.
This article is written for finance and analytics professionals, not data scientists. The focus is on practical, accessible steps that sit on top of existing BI and finance systems. We will explore why static reporting is no longer enough, what foundations you really need, how to layer AI into current tools, and where finance teams can start with tangible, real‑world use cases - mirroring the data‑led, AI‑enabled operating models described in industry analyses.
Why move beyond static reporting?
Finance and analytics teams sit on rich data but often use it only to explain what has already happened. Static packs and dashboards were designed for periodic control, not for fast, forward‑looking decisions. As markets move faster and regulatory expectations rise, that gap becomes costly.
Independent analysis from Morningstar notes that firms relying solely on backward‑looking reports “risk their competitive positioning and ultimately weaker operating and financial metrics”, even when they are awash with data. The opportunity is to turn the same core data into living, AI‑enabled insights that continuously predict risk, performance, and cash - and recommend what to do next.
The move is not about ripping out your BI or ERP stack. It is about layering smarter analytics on top of trusted data so that each forecast, board paper, or investment memo is grounded in up‑to‑date evidence, not just last month’s snapshot.
At a practical level, this shift:
- Shortens time from event to insight.
- Reduces reliance on gut feel and one‑off spreadsheets.
- Makes scenario thinking and stress‑testing routine, not exceptional.
The rest of this article will show how to get there with manageable steps rather than a wholesale transformation.
The limits of traditional reports
Static reporting struggles with three core issues: speed, fragmentation, and depth of insight.
Reports are typically:
- Slow: built on month‑end closes or weekly batches, so pricing, hedging, or allocation decisions may land after the real window of opportunity. In sectors like commercial real estate, that lag has been shown to mask rapid shifts in valuations and risk exposures until it is too late.
- Fragmented: numbers differ across ERP, BI, and spreadsheets because definitions, mappings, and entitlements are not aligned.
- Purely descriptive: they answer “what happened?” but rarely “what next?” or “what if?”.
In finance and investment settings, that translates into:
- Decisions on credit, capital allocation, and portfolio tilt made on partial or stale views.
- Limited scenario work: one base forecast and perhaps a “downside” tab, with little systematic stress‑testing of liquidity, losses, or margins.
- Teams spending disproportionate time reconciling and cleansing data, instead of interrogating drivers and options.
Research from Cornerstone Advisors suggests many banks are still “flying in the dark”, with only 29% saying key decisions rely on accurate, timely and actionable data and just 17% reporting clean, real‑time data across systems. Even when data is plentiful, the lack of harmonised, trusted “intelligent data” means that effort goes into assembling the picture rather than exploring actions.
What AI‑enabled analytics change
AI‑enabled analytics extend the stack from rear‑view reporting to an ongoing cycle of prediction and recommendation.
You can move from descriptive to:
- Predictive analytics: rolling forecasts for revenue, margin, cash, working capital, defaults, or fraud risk that refresh as new data lands.
- Prescriptive analytics: ranked suggestions such as next‑best action on collections, dynamic pricing recommendations, or proposed spend holds and hedges.
- Near real‑time views: continuously updated positions instead of month‑end or quarter‑end snapshots.
In practice, this often means embedding AI into systems people already use:
- Banks and asset managers add predictive layers to existing risk and performance platforms, scoring exposures across portfolios and surfacing emerging stress.
- Investment teams turn static PDFs, filings, and research notes into live dashboards that track sentiment, key themes, and risk signals, with scenario sliders rather than static charts.
Regulators are starting to expect this kind of forward‑looking use of data. The UK Financial Conduct Authority’s work on AI in financial markets highlights AI’s role in anticipating risk and tailoring actions, provided firms can explain and govern the underlying models. In parallel, finance‑specific research from the CFA Institute shows practitioners increasingly layering AI on top of Excel and BI tools to turn the same datasets into continuous, model‑driven insights.
The crucial point is integration: predictions and recommended actions appear inside the familiar ERP, EPM, BI, or productivity tools, sharply reducing “swivel‑chair” effort and speeding the path from signal to decision.
Human judgement stays central
AI does not replace finance or investment professionals; it changes how they spend their time.
A practical role split looks like this:
AI handles: large‑scale pattern recognition, anomaly detection, first‑pass variance analysis, narrative drafting, and surfacing of alternative scenarios.
Humans handle: business context, interpretation of policy and regulation, trade‑offs between risk and return, and ultimate accountability for decisions.
Morningstar’s own AI guidance is explicit that “the long‑term benefits… require financial institutions to maintain human oversight and embrace transparency”, with AI copilots embedded into existing workflows rather than standalone black boxes.
In other words, the real competitive divide is between analysts, portfolio managers, and finance teams who use AI as a co‑pilot, and those who continue to rely solely on static packs and manual analysis.
The goal is not fully automated decision‑making; it is faster, more consistent decisions made by informed humans, with clear traceability from data to conclusion. The following sections will outline low‑friction ways to evolve from today’s static reporting packs to this assisted, forward‑looking model without rebuilding your entire technology stack.
Download our AI Data Analytics Tool Selector
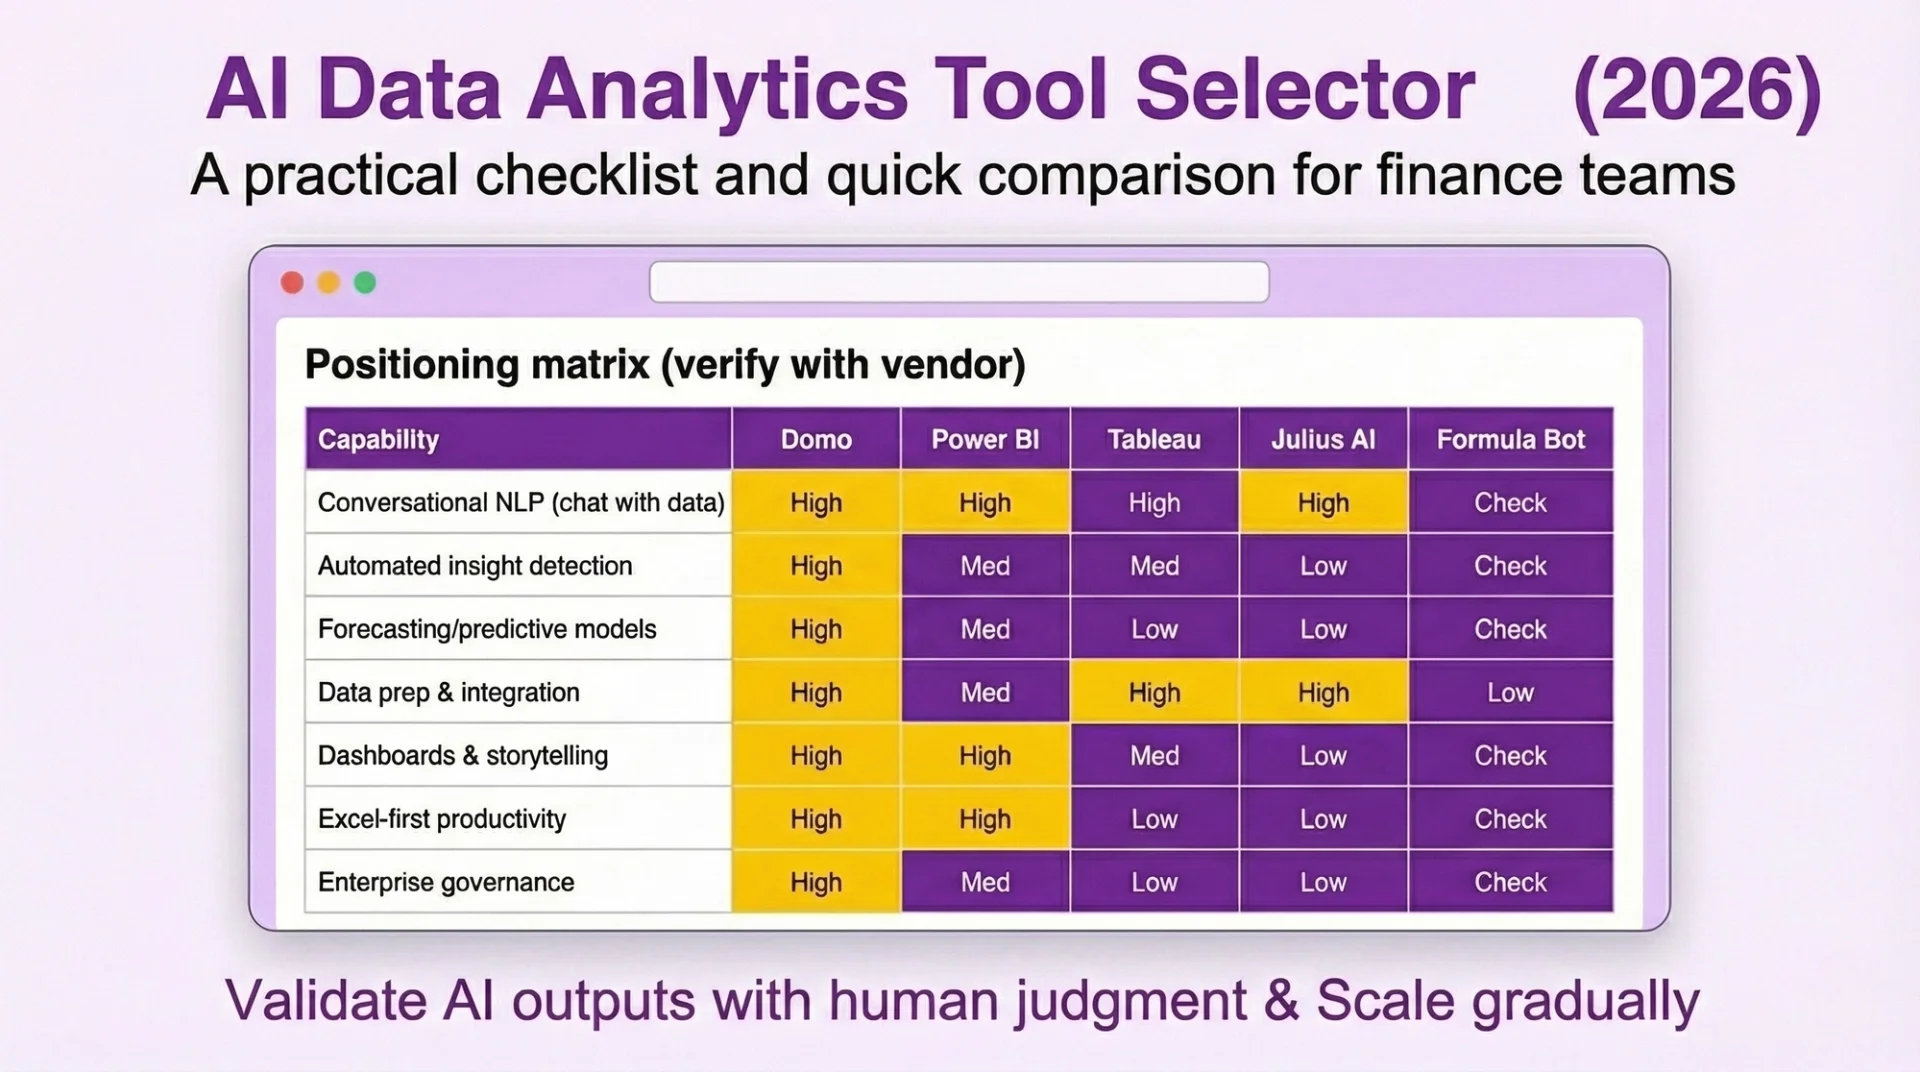 Download now
Laying the foundations: data, integration, and trust
To move from static reporting to predictive, action‑oriented analytics, you do not start with models; you start with the groundwork. Four elements matter most: intelligent data, smart integration, built‑in trust, and a clear operating model.
Intelligent data, not just more data
Most AI pilots fail because the data is fragmented or ambiguous, not because the model is weak. External studies consistently find that weak data foundations are the main barrier to AI ROI; for example, research summarised in Business Insider reports that many enterprises see **no measurable return** on AI investment where data quality and governance are poor, despite significant spend on tooling and models.
“Intelligent data” in finance means:
- Harmonised definitions for core concepts such as customer, product, region, exposure.
- A semantic layer or unified data model spanning finance and operational systems.
- Documented KPIs and metrics that align with policies, budgets, and planning models.
Morningstar describes this as making data “investment‑grade”: structured, explainable, and traceable end‑to‑end before AI is allowed anywhere near it. Without that discipline, AI simply amplifies existing inconsistencies.
You do not need to fix every dataset upfront. Focus on the domains that drive your first AI use cases, such as:
- Revenue and margin
- Operating costs
- Working capital and cash
- Key risk metrics
AI can help you improve data quality as you go, by spotting duplicates, mismatches, and anomalies. Financial‑services practitioners increasingly talk about using “AI for data before data for AI”: deploying machine learning to automate mapping, deduplication, and anomaly detection in complex estates so that downstream analytics become more reliable. The key is to wrap this with validation rules that reflect finance logic, confidence scores to show how reliable each suggestion is and human review for anything material.
This combination turns raw data into a trustworthy asset that models – and people – can rely on.
Integrate AI where people already work
Adoption depends on meeting users in the tools they use every day, not giving them yet another portal. That means embedding AI into:
- ERP/EPM and finance platforms for assisted reconciliations, faster close, and automated variance explanations.
- BI tools such as Power BI, Tableau, or Qlik for conversational queries, narrative commentary, and on‑demand what‑if analysis.
- Excel and office suites for copilots that draft analysis, summarise movements, and build slides.
This “AI in the flow of work” pattern is how leading vendors are rolling out capabilities. Microsoft’s recent “deep reasoning” Copilot agents, for example, sit directly inside Microsoft 365, connect to systems like Salesforce and ServiceNow, and can turn messy, multi‑source data into structured analysis and narrative in a single workflow.
Under the surface, three principles keep this manageable:
- One semantic layer or governed warehouse as the single source of truth.
- Connectors that respect existing entitlements, so users only see authorised data.
- Extending your current stack rather than building parallel “AI systems” on the side.
The outcome is that predictive insights appear in the same reports and workflows people already trust, mirroring the way firms such as Morningstar are exposing AI‑ready data directly inside tools like Excel, Teams, and Power BI rather than via standalone portals.
Trust by design: explainability, auditability, and control
In finance and investment, AI must be as defensible as any other control. That means systems should:
- Explain forecasts and recommendations in terms of inputs, drivers, and rules.
- Maintain audit trails of prompts, data sources, model versions, approvals, and overrides.
- Keep humans in the loop for material decisions such as large credit limits or major structural budget shifts.
Regulators are converging on this system‑level view. The UK Financial Conduct Authority, for instance, explicitly frames AI as an “ecosystem of people, processes and technologies” and expects firms to demonstrate transparency, accountability, and robust oversight wherever AI influences customer or market outcomes. In practice, that translates directly into how finance functions design their analytics stack.
Practical guardrails to build from day one include:
- Confidence thresholds that decide when to auto‑act versus escalate for review.
- Clear escalation routes when models flag anomalies or high uncertainty.
- A “kill switch” to pause or roll back models if behaviour drifts or rules change.
Trust is not a soft concept here; it is what allows regulators, auditors, and executives to accept AI‑enabled decisions. As Morningstar puts it, the long‑term benefits of AI in finance only appear when institutions “maintain human oversight and embrace transparency” around how models behave and what data they use.
Operating model and skills
Technology on its own rarely changes outcomes. You also need an operating model and skills that fit AI‑enabled work:
- Named owners for data, models, and business outcomes.
- Explicit agreement with business leaders on where AI supports, and where it is allowed to decide.
- Upskilling in data literacy and AI‑driven workflows: how to prompt, interpret outputs, and challenge assumptions.
Recent guidance on data operating models stresses that many AI investments stall not for lack of tools, but because ownership, decision rights, and collaboration between business and data teams are unclear. Making those boundaries explicit inside finance functions is as important as any model choice.
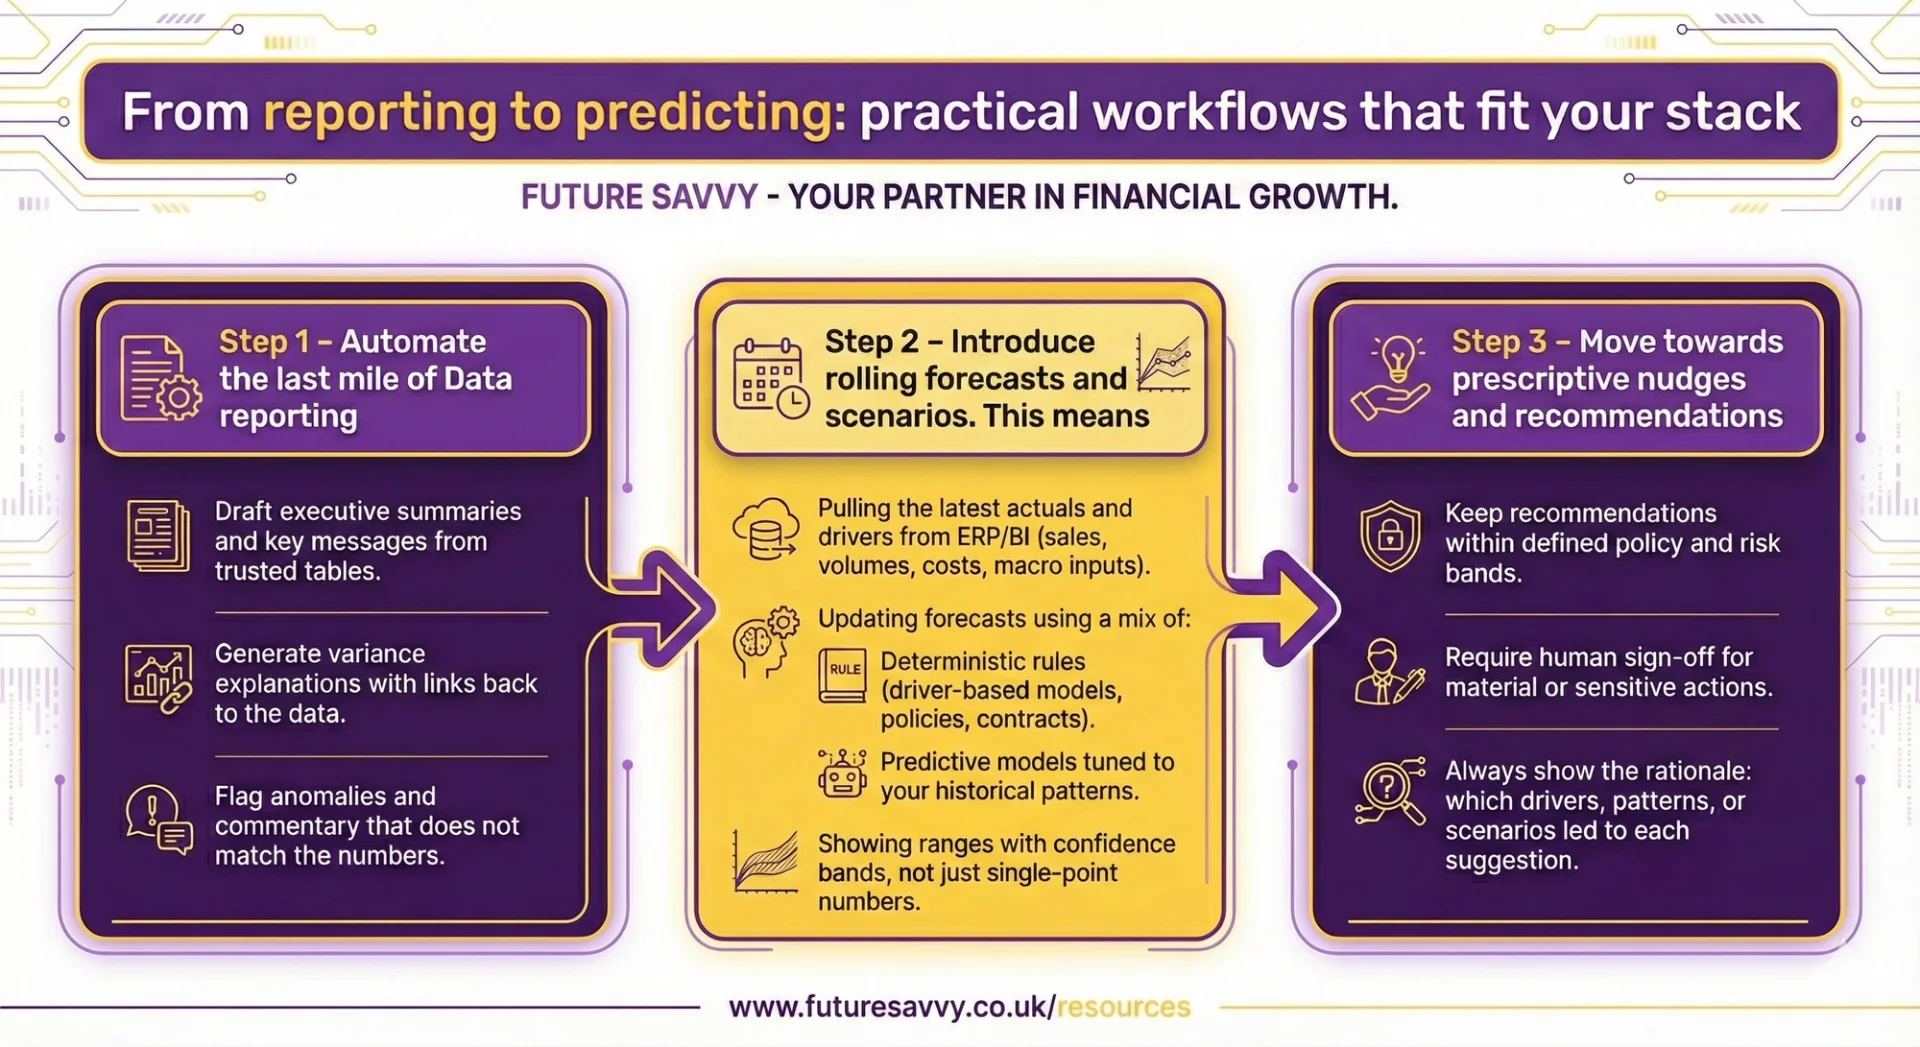
From reporting to predicting: practical workflows that fit your stack
Transforming your reporting does not mean ripping out your existing BI or finance systems. The smartest path is to evolve workflows in stages, using the governed data and tools you already trust. As Morningstar puts it, powerful AI only delivers value “after the models, prompts, and prototypes come well-prepared data”, so the focus is on augmenting what works rather than starting again.
Step 1 – Automate the last mile of Data reporting
Start where risk is low but effort is high: monthly packs, management reports, and board decks. Your BI models already calculate the numbers; AI simply turns them into narratives.
On top of your existing semantic layer and KPIs, AI can:
- Draft executive summaries and key messages from trusted tables.
- Generate variance explanations (volume, price, mix, FX, one‑offs) with links back to the data.
- -Flag anomalies and comntary that does not match the numbers.
This aligns with the pattern seen in the CFA Institute’s work on AI and big data in investments, where generative tools are increasingly used to automate routine commentary and monitoring while existing models remain the source of truth for calculations.
A typical pattern is:
1. AI produces a first‑draft narrative and highlights inconsistencies.
2. Analysts review, correct, and approve; edits are logged for audit and learning.
3. The system reuses that feedback so future drafts need less rework.
Banks that have followed this “augment, do not replace” approach report tangible gains: Finextra notes that institutions embedding AI into reporting workflows see faster time‑to‑insight and fewer reconciliation firefights as models learn from previous human corrections and governance rules.
Step 2 – Introduce rolling forecasts and scenarios
With the “last mile” automated, use the same governed data to keep forecasts live rather than locked in a quarterly cycle. This mirrors what SAP describes in its work on AI‑driven sales forecasting, where connected data and predictive models turn static spreadsheets into continuously updated, scenario‑ready views.
In finance terms, this means:
- Pulling the latest actuals and drivers from ERP/BI (sales, volumes, costs, macro inputs).
- Updating forecasts using a mix of:
- Deterministic rules (driver‑based models, policies, contracts).
- Predictive models tuned to your historical patterns.
- Showing ranges with confidence bands, not just single‑point numbers.
End users should access this inside their normal tools:
- Ask in natural language: “What changed since the last forecast?” or “Where is cash risk highest in the next 90 days?”.
- Run simple what‑ifs directly in BI or planning tools and see P&L, cash, and ratio impact instantly.
To keep this trustworthy:
- Make assumptions, drivers, and sensitivities transparent.
- Allow users to override model outputs and document why.
- Log overrides and outcomes to refine future model behaviour and governance.
Regulators are already leaning in this direction: the UK FCA’s guidance on AI in financial markets explicitly encourages firms to use AI for forward‑looking risk and affordability checks, provided the models are explainable, monitored, and subject to human override.
Step 3 – Move towards prescriptive nudges and recommendations
Once rolling forecasts are in place, you can layer on targeted, in‑workflow suggestions.
Examples include:
- Working capital: when DSO or ageing trends worsen, recommend specific customer follow‑ups or revised terms.
- Spend and budgeting: flag recurring overspends and suggest phasing changes or savings levers.
- Risk and compliance: highlight exposures nearing limits and propose mitigating actions.
Design these nudges with control in mind:
- Keep recommendations within defined policy and risk bands.
- Require human sign‑off for material or sensitive actions.
- Always show the rationale: which drivers, patterns, or scenarios led to each suggestion.
This echoes what Finextra describes as the shift to “data‑led, assistive intelligence” in financial services. AI suggests next best actions, but accountability and final decisions stay with experienced professionals.
What this looks like in common toolsets
You do not need a new platform; most ecosystems now support these patterns natively or via light add‑ins. The CFA Institute’s survey work on creating value from big data finds that practitioners overwhelmingly layer AI on top of Excel and existing BI tools rather than abandoning them.
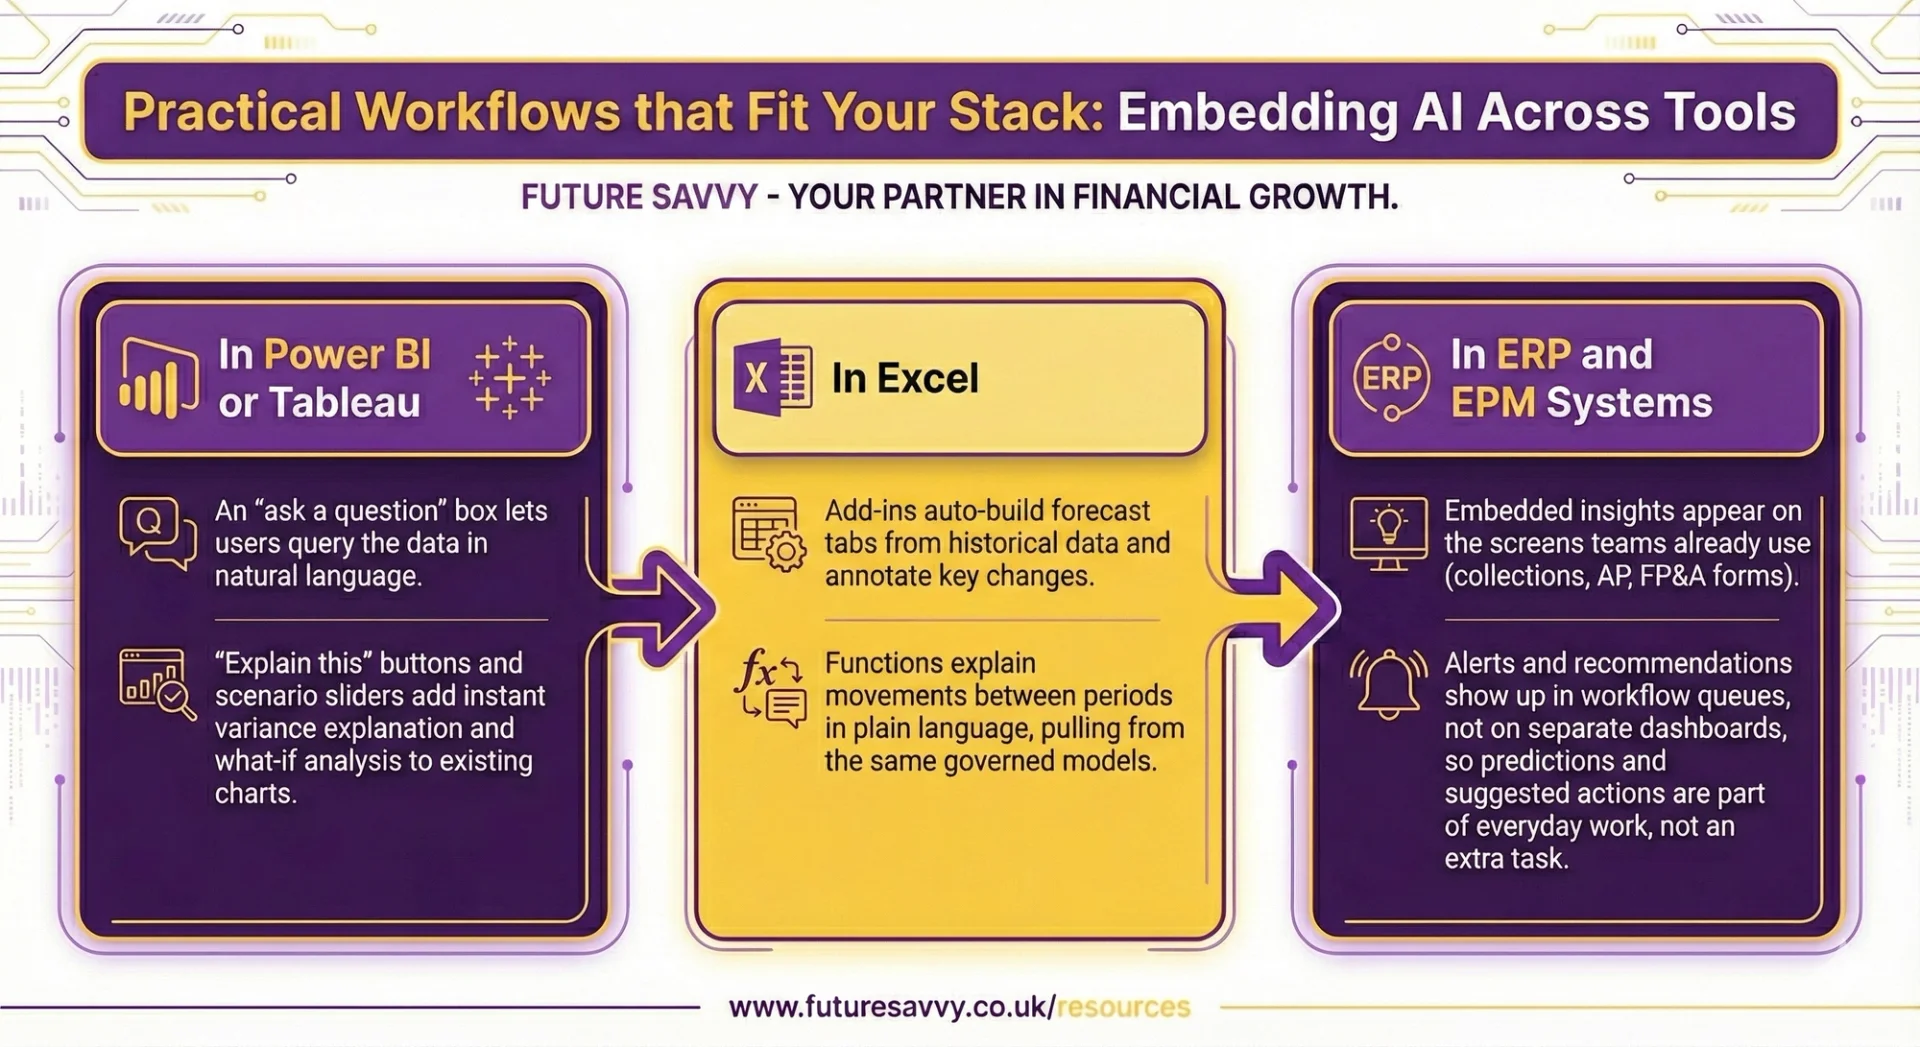
As Microsoft rolls out deeper “reasoning” agents in its 365 suite, analysts can increasingly move from “build a report” to “ask a complex question and iterate”, with the AI generating Python, SQL, and narrative drafts behind the scenes while remaining anchored to governed enterprise data.
Everyday use cases: where to start and how to scale
AI in finance does not need to start with a moon‑shot. The fastest wins come from embedding intelligent automation into the work you already do, inside the tools you already use.
Quick‑win finance use cases
Management and board reporting
Instead of spending days crafting slide decks and commentary, AI can draft the first cut for you:
- Auto‑generated narratives for P&L, balance sheet, cash flow and KPI packs.
- Consistent variance explanations across entities and regions, grounded in your governed finance data.
This mirrors how leading tools now blend deterministic calculations with generative narratives to explain drivers of performance and risk in plain language, an approach highlighted by the CFA Institute’s work on explainable AI in finance.
You review, adjust tone and emphasis, and maintain control over the story while cutting production time sharply.
Close and reconciliations
Machine‑learning models are already strong at spotting issues buried in large volumes of transactions:
- Anomaly detection to flag unusual entries, duplicate postings or out‑of‑pattern journals before close.
- AI‑assisted matching and exception routing for bank, intercompany and subledger reconciliations.
This “clean‑as‑you‑go” approach improves data quality and shortens close cycles without changing your chart of accounts or ERP. As Finextra notes, firms increasingly use AI to “self‑heal” data issues inside modern cores, combining real‑time anomaly detection with audit trails to satisfy regulators as well as controllers.
Rolling forecasts and planning support
Rather than rebuilding forecasts manually each quarter, AI can:
- Refresh revenue, cost and cash forecasts as new actuals land.
- Trigger alerts when key assumptions diverge from recent trends or market data.
Planners remain accountable for the numbers; AI simply surfaces shifts earlier and suggests which drivers to revisit. In practice, this is the pattern seen in many AI‑driven forecasting dashboards, where models continuously learn from new data and propose updated scenarios and risk flags on top of existing BI tools.
Analytics in risk and investment contexts
Credit and fraud analytics
Pattern‑recognition models scan portfolios and transactions in near real time, highlighting items for human review:
- Outlier exposure profiles, unusual repayment behaviours or sudden concentration risks.
- Suspicious transaction patterns that indicate potential fraud or account takeover.
This shifts effort from trawling reports to investigating the riskiest cases. Banks using embedded ML in their cores are already reporting fewer false positives and richer explanations for each alert, aligning with supervisory expectations for transparent, risk‑based monitoring.
Investment research and sentiment
Natural language tools can read what you do not have time to:
Extract sentiment and themes from earnings calls, filings, news and research.
Feed signals directly into existing performance and risk dashboards as additional inputs, not a separate system.
CFA Institute research shows that NLP and large language models are now routinely used to turn unstructured text into investment signals, particularly around management tone, ESG controversies and emerging risks. Analysts get rapid context and can challenge or refine the signals rather than starting from a blank page.
ESG and sustainability insight
AI can monitor the expanding ESG universe at scale:
- Scan disclosures and media against your defined ESG criteria.
- Produce transparent scores with links back to underlying evidence so you can check the rationale.
Morningstar’s own ESG and thematic classifications follow a similar “AI plus human” model: NLP flags relevant disclosures, then analysts validate tags and ensure they reflect the actual strategy and risk profile, keeping outputs explainable and audit‑ready.
Choosing first projects and avoiding pilot purgatory
Strong early choices prevent AI becoming an endless experiment. Prioritise use cases with:
- Clear outcomes (hours saved, forecast error reduced, manual exceptions cut).
- Reasonable data quality in a bounded domain.
- Acceptable regulatory risk and a visible business sponsor.
Industry surveys suggest that lack of these basics is why so many pilots stall: Info‑Tech’s analysis of stalled AI investments points to unclear ownership, weak links to business outcomes and over‑engineered prototypes that never embed into real workflows as common failure modes.
Treat the first wave as controlled experiments:
- Define success metrics upfront and baseline current performance.
- Run limited pilots embedded in existing BI or finance tools.
- Review results quickly, refine scope or stop if value is not material.
The aim is a short path from idea to decision: scale what works, retire what does not.
Scaling what works
Once a handful of use cases are delivering, shift from one‑offs to a reusable platform:
- Standardise data access, security, logging, prompts and report templates.
- Define guidelines for when and how AI may be used in reporting, forecasting and risk analysis.
People and culture are as important as technology:
- Train teams to interrogate AI outputs, ask for evidence and request alternative scenarios. As Morningstar’s AI guidance puts it, “the long‑term benefits… require financial institutions to maintain human oversight and embrace transparency”.
- Build feedback loops so user comments, overrides and outcomes feed back into models and workflows.
- Emphasise that AI exists to raise the speed and quality of decisions, not to sideline finance and analytics professionals.
In summary, successful teams move stepwise: start with targeted, measurable use cases; embed AI in existing workflows; and then scale on a common foundation that keeps humans firmly in charge.
Turn Today’s Reports into Tomorrow’s Decisions
The shift is clear in Data Analytics and AI is clear: finance and analytics teams are moving from static, backward‑looking packs to predictive and prescriptive insights that sit inside the tools people already use. Spreadsheets full of manual commentary are giving way to governed data, AI‑assisted narratives, and rolling scenarios that update as the business moves.
This is practical now because you can start small and stay within your existing BI, ERP, EPM, and Excel estate. Focus first on a few critical data domains, then let embedded AI draft explanations, flag anomalies, and simulate “what if?” options. Trust is built in by design through explainable logic, audit trails, and human sign‑off where the stakes are high.
Frequently Asked Questions (FAQ)
Prompting, verification, workflow design, automation, and responsible AI use.
No. These skills apply across functions, from admin and marketing to finance and operations.
Clear examples of how you used AI to save time, improve quality, or support better decisions.
Begin with your current tasks, test AI on repeat work, and track the results.
Related Articles
 L&D Insights
Best AI Tools for Data Analytics in Finance 2026
AI is reshaping how finance teams analyse data - moving beyond manual spreadsheets to faster, smarter insights powered by machine learning and natural language. This blog post breaks down what AI data analytics is in 2026, the must-have features to look for, and how the “full-stack analyst” is emerging inside modern tools. You’ll also get a practical review of the best no-code AI analytics platforms for finance - plus tips to implement them confidently.
 Tips & Tricks
AI Investing: The Future of Personal Wealth
AI investing gets thrown around as a buzzword, but it can mean very different things - from buying “AI stocks” to using AI tools inside the investment process. This article focuses on the practical middle ground: how robo-advisers, systematic trading tools, and AI research co-pilots support research, portfolio construction, monitoring, and reporting. It explains where AI adds real value (speed, scale, personalization, risk and compliance) and where it can go wrong (hype, opacity, weak controls, and scams).
- L&D Insights
