- L&D INSIGHTS/
- Best AI Tools for Data Analytics in Finance 2026/


Best AI Tools for Data Analytics in Finance 2026
- L&D INSIGHTS/
- Best AI Tools for Data Analytics in Finance 2026/
Best AI Tools for Data Analytics in Finance 2026
Artificial intelligence (AI) is transforming how financial organisations analyse data. AI-powered data analytics refers to using machine learning and smart algorithms to automate and enhance data analysis. Instead of manual spreadsheets and static reports, analysts can leverage AI to quickly surface patterns, forecasts, and insights from large datasets,
In this article, we’ll explore what AI data analytics entails, its key features, and review the best AI tools for data analytics (with a focus on no-code solutions popular in finance). By the end, you’ll see how these tools can turn mountains of financial data into actionable intelligence.
What Is AI Data Analytics and How Does It Work?
To select the optimal tools, one must first deconstruct what "AI Data Analytics" signifies in the financial context of 2026. It is not simply the digitalisation of calculation. It is the application of machine learning, natural language processing (NLP), and generative agents to the entire financial value chain, creating a "Full-Stack Analyst" capability within software.
The Core Components of the Modern AI Stack
AI analytics in finance acts as a layered architecture, where each component handles a specific cognitive or mechanical task:
The Rise of the "Full-Stack" Analyst
The democratisation of these tools has given rise to the "Full-Stack Analyst". In previous decades, a finance function required a fragmented team: a data engineer to clean data, a data scientist to build models, and a financial analyst to interpret results. This fragmentation created latency and translation errors.
In 2026, tools like Julius AI, Power BI Copilot, and Domo.AI allow a single financial professional to perform all three roles simultaneously. The best AI tools for data analytics acts simulatenoysly as the engineer (cleaning messy CSVs and standardizing schemas), the scientist (running regression models and detecting outliers), and the visualization expert (building aesthetic and compliant charts).
This shifts the required skill set for finance professionals from "Excel mastery" to "Data Literacy and Prompt Engineering". The value add of the human professional is no longer in gathering the data, but in verifying the AI's logic, applying ethical judgment, and making the final strategic decision.
Need help identifying the right skills to take you to the next level? Our Training Needs Analysis Form is the exact tool to identify your personal or your team’s learning needs and address them adequately!
Key Features of AI-Powered Data Analytics Tools
Modern AI analytics platforms come with a range of features that make data analysis faster and more accessible. Here are some key features to look for when choosing the best AI tools for data analytics:
- Natural Language Querying (NLP): Allow users to ask questions in plain English and get answers with charts or narratives. This conversational approach lets non-technical users explore data without writing SQL or code. For example, you can type “Show profit trends by quarter” and the tool will generate the analysis.
- Automated Insight Detection: AI algorithms automatically detect patterns, trends, and anomalies in your data. The tool might flag an unusual spike in expenses or highlight a correlation (e.g. a surge in card transactions every Friday) that you might have missed. These proactive alerts surface insights without manual digging.
- Predictive Analytics & Forecasting: Built-in machine learning models use historical data to forecast future outcomes like revenue, risk scores, or market trends. In finance, this means AI can help predict things like cash flow, stock performance, or loan default probabilities, giving a forward-looking edge in decision-making.
- Prescriptive Recommendations: Beyond predicting “what might happen,” some advanced tools suggest next best actions. For instance, if an AI sees that marketing spend is yielding diminishing returns, it might recommend reallocating budget to higher-ROI areas. This turns insight into actionable guidance (the “what to do next” aspect of analytics).
- Augmented Data Preparation: AI can automate data cleaning and integration. These tools might automatically merge data from different sources, fix formatting inconsistencies, or even suggest transformations. This saves analysts tons of time in the prep stage and ensures data quality.
- AI-Driven Visualisations: Instead of manually choosing chart types, the tool can suggest or create the best visualisations to communicate the data. For example, it might generate a graph to answer your question and even provide a written explanation of the key insight. This helps in quickly turning raw data into understandable visuals.
- Integration with Existing Tools: The best platforms connect to your data sources (databases, cloud storage, spreadsheets, etc.) and other software. Seamless integration means AI insights can pull in data in real-time and even embed into tools you already use (like Excel or BI dashboards). This is important for finance teams dealing with data spread across CRM, ERP, and other systems.
- Security and Governance: Enterprise-grade AI analytics tools include strong security, access controls, and compliance features – crucial for financial data. They often provide encryption, user permission management, and audit trails. (For example, Julius AI ensures data privacy and is compliant with standards like SOC 2 and GDPR.) Robust governance means you can trust the AI’s output is based on accurate, authorised data.
These features collectively make AI analytics tools powerful. They enable a conversational, automated, and intelligent approach to data – from data prep and analysis to visualisation and insight delivery – all while ensuring usability and security for businesses.
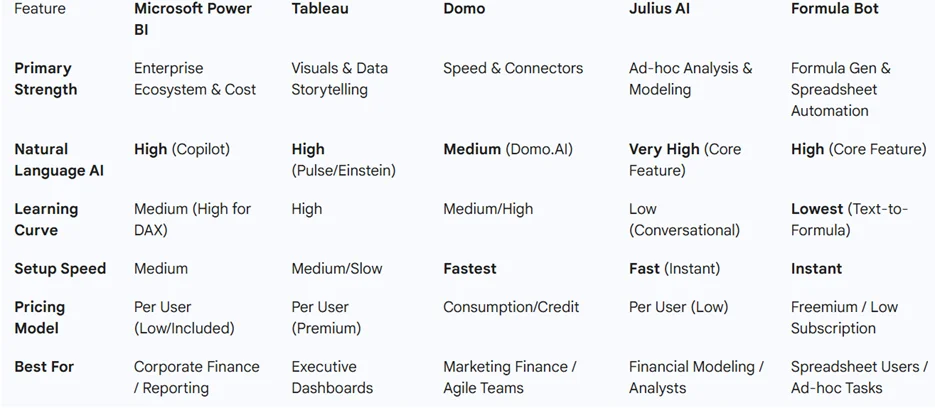
Top 5 Best AI Tools for Data Analytics
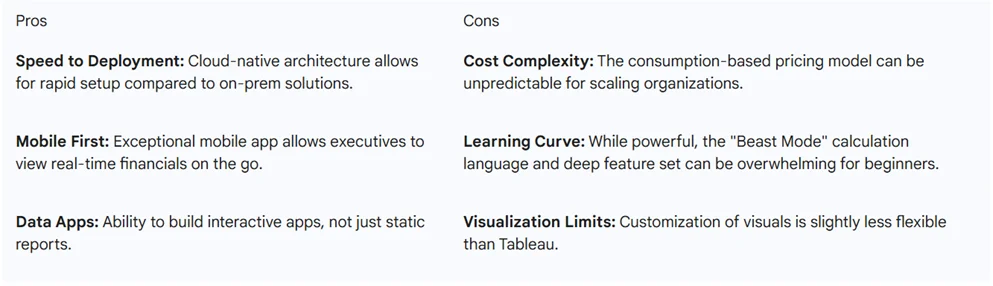
Domo
What it is: Domo is an end-to-end cloud data analytics platform geared towards enterprises. It allows you to connect, prepare, and visualise data in one place. Domo has robust built-in AI capabilities: an AI service layer that streamlines data delivery and an intelligent chat interface where you can ask questions of your data in plain language. This makes Domo ideal for organizations that want a one-stop solution for BI with AI features.
Who it’s for: Domo is great for mid-to-large companies that need to handle large datasets and want a no-code platform for both data prep and analytics. Business users can get guided insights through Domo’s AI, while data teams can integrate their own models if needed. (
Pros & Cons
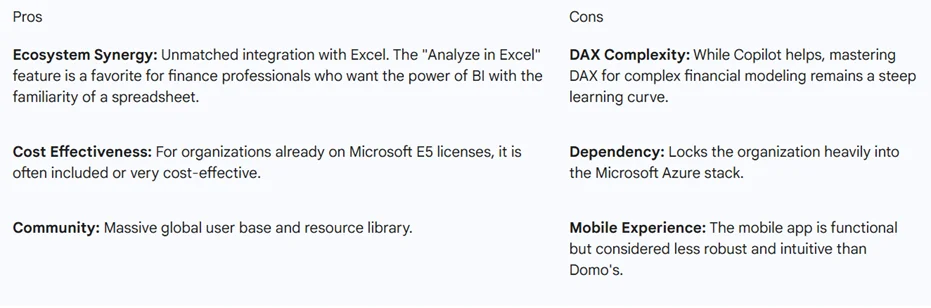
Microsoft Power BI
What it is: Microsoft Power BI is a leading business intelligence tool that now comes with built-in AI features. It enables users to create interactive reports and dashboards, and it integrates exceptionally well with the Microsoft ecosystem (Excel, Azure, SharePoint, etc.). Power BI has introduced AI visuals (like Key Influencers, which uses machine learning to explain drivers in your data) and even a natural language Q&A feature.
Who it’s for: Power BI is ideal for organizations already using Microsoft products or anyone looking for a powerful yet user-friendly analytics tool. Financial analysts who are comfortable with Excel will find Power BI familiar. It’s used across industries, from banking (for interactive financial reporting) to retail (for sales and inventory analysis).
Pros & Cons
Download our AI Data Analytics Tool Selector (2026)
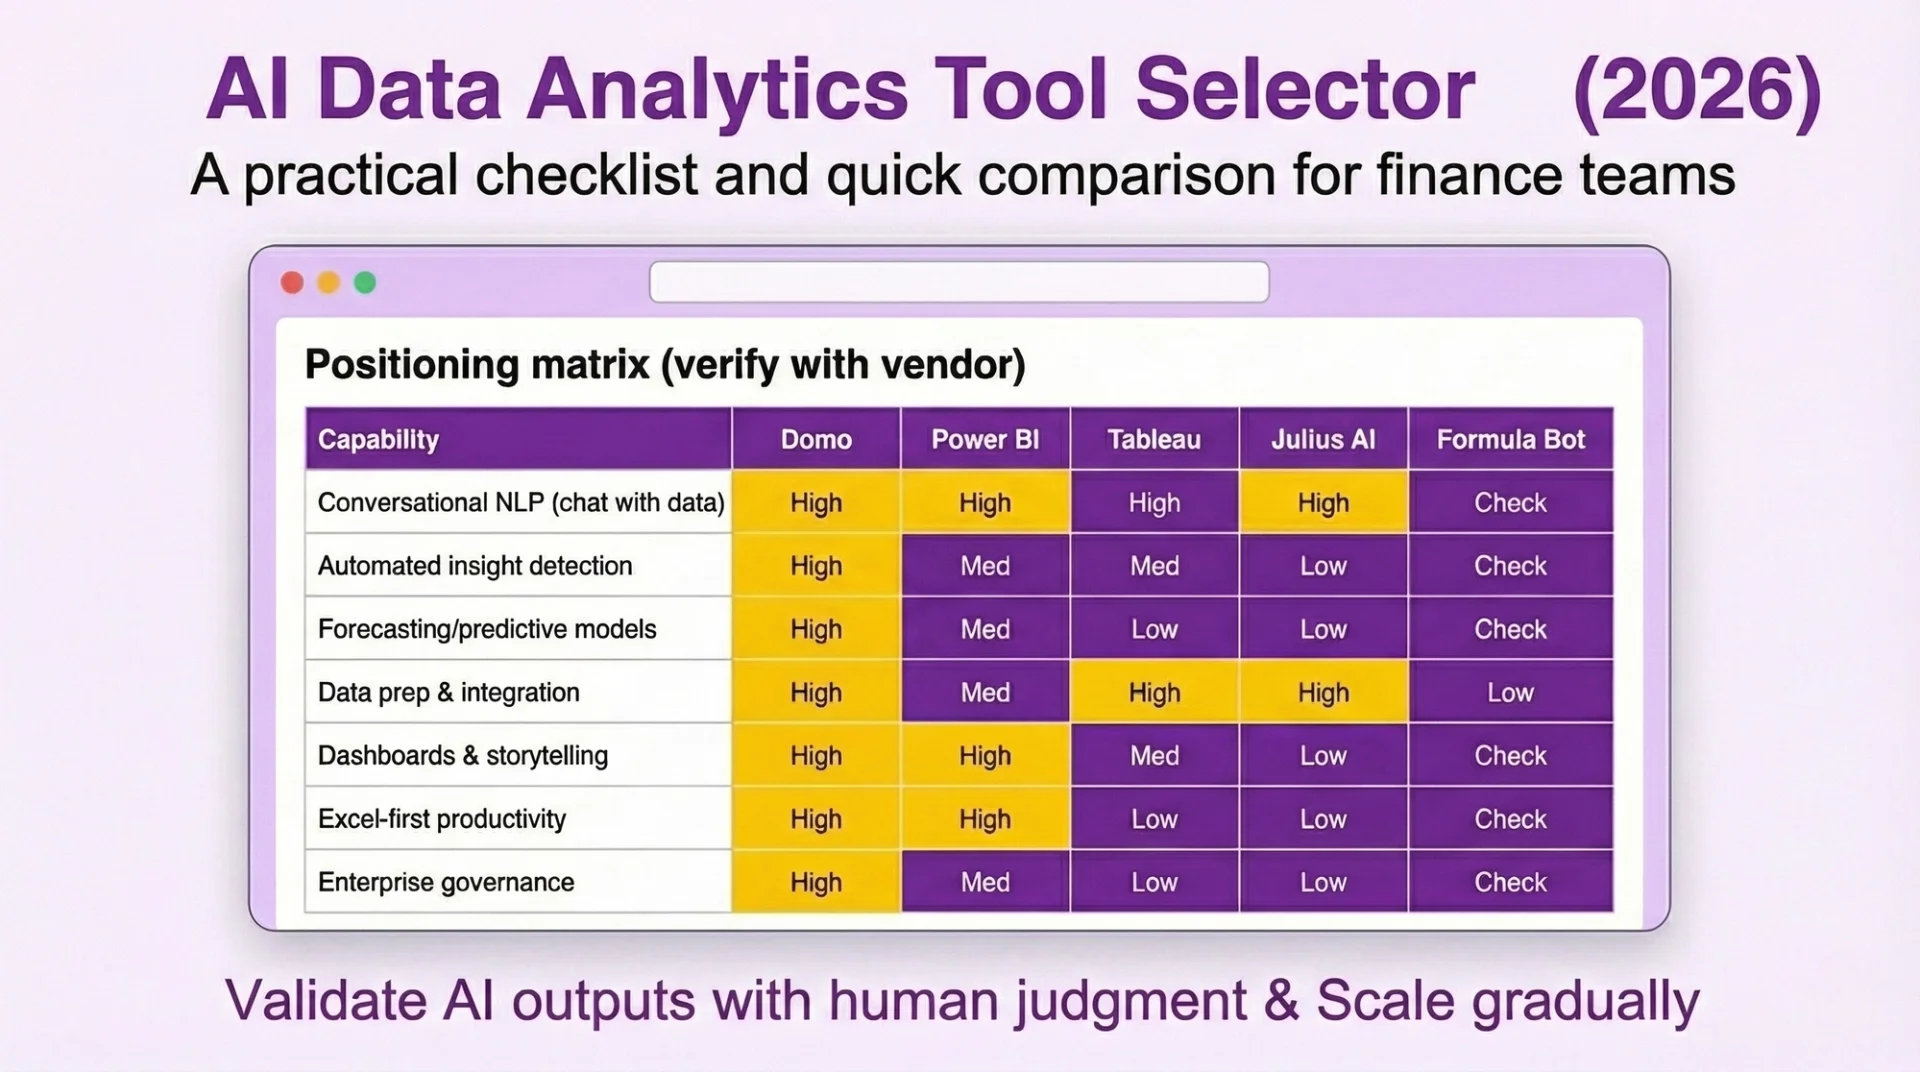 Download now
Tableau
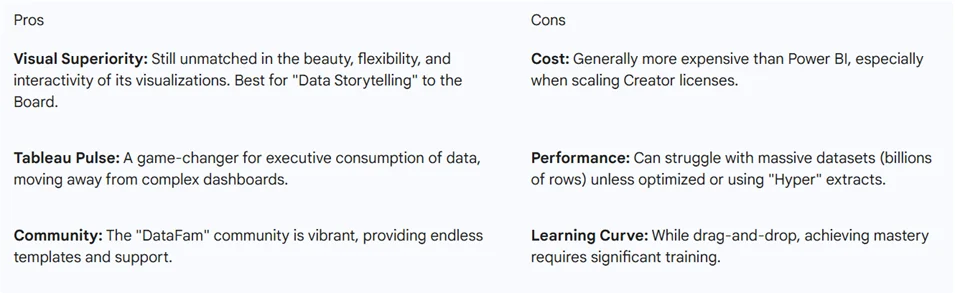
What it is: Tableau is another top-tier business intelligence tool known for its rich visualisations. Now under Salesforce, Tableau has infused AI (including Salesforce’s Einstein AI) into its analytics experience. It offers features like Tableau GPT and Tableau Pulse (new in 2025) which use AI to make analysis easier and more proactive. Tableau excels at turning complex data into interactive, shareable dashboards and is popular in finance for everything from financial statement analysis to risk dashboards.
Who it’s for: Tableau is great for organisations that value powerful visuals and have diverse data sources. It’s widely used by financial services firms, banks, and insurers for its ability to handle big data and create executive-friendly dashboards. While it has a bit of a learning curve for newbies, it’s loved by analysts and has a strong community. Non-technical business users can now leverage Tableau’s AI features to get insights without deep technical skills.
Pros & Cons
Julius AI
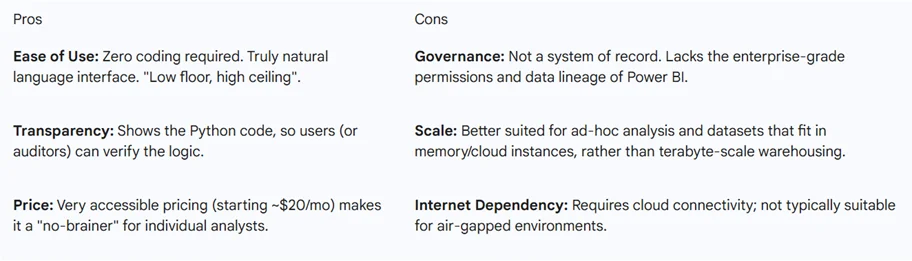
What it is: Julius AI is an AI-first data analysis tool that lets you “chat” with your data. Think of it as having a virtual data analyst on demand. You connect your datasets – whether spreadsheets, databases, or cloud data – and then you can ask Julius questions in plain English. It will instantly analyze the data and give you answers, often with charts or tables. No coding is required at all. For example, you could upload a CSV of financial transactions and ask, “What was the average transaction value each month?” and Julius will calculate it and perhaps plot a trend line.
Who it’s for: Julius is ideal for business users and teams who have data but lack extensive data science skills. A financial analyst or even a non-analyst (like a finance manager) can use Julius to get insights without relying on the BI team for every query. It’s great for quick exploratory analysis, ad-hoc questions in meetings, or when you want insights without building a full dashboard. In finance, it can be used for things like scanning through expense data for anomalies, analysing portfolio metrics, or summarising financial results with minimal effort.
Pros & Cons
Formula Bot
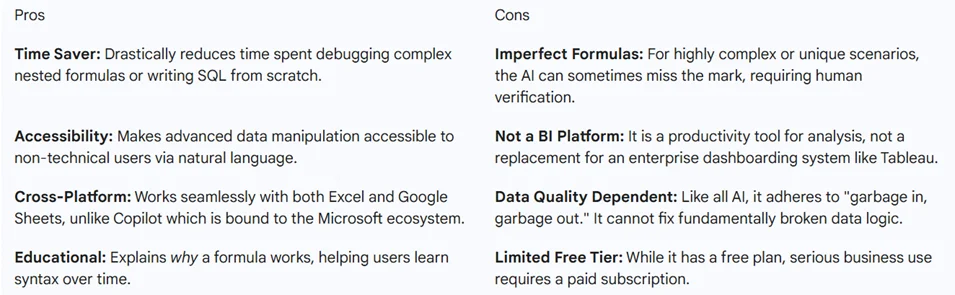
What it is: Formula Bot (often called Excel Formula Bot) is an AI-powered assistant specifically designed to work with spreadsheet data (Excel or Google Sheets). It’s like having a smart helper for Excel that can instantly generate formulas, create charts, and even write macros based on plain English instructions.
For example, if you don’t remember how to write a complex Excel formula, you can simply describe what you need (“calculate the CAGR of revenue from 2018 to 2023”) and Formula Bot will produce the correct formula or answer. Essentially, Formula Bot turns natural language into formulas, charts, and analysis – making Excel and Sheets much more powerful for everyday users.
Who it’s for: This tool is a dream for anyone who works heavily in Excel but isn’t an Excel guru, or who wants to automate their spreadsheet tasks. In finance, that’s a lot of people – financial analysts, accountants, planners who live in Excel models can use Formula Bot to speed up their work. It’s great for quickly generating reports from raw data, cleaning up data, or getting charts without manual effort. Small businesses that manage finances in spreadsheets can use it to get automated insights.
Pros & Cons
Choosing the Best AI Tool for Data Analytics
Selecting the right tool depends heavily on the organisation's maturity, existing stack, and specific financial use cases.
Power BI vs. Tableau: This remains the classic "Microsoft vs. Salesforce" battle. Power BI wins on cost and ubiquity; if your company runs on Office 365, Power BI is the logical choice. Tableau wins on "beauty" and flexibility; if your primary goal is to present compelling narratives to the Board, Tableau is superior. However, Power BI's "Copilot" is currently outpacing Tableau's AI features in terms of practical report generation.
Domo vs. The Rest: Domo is the "Special Forces" tool. It is often brought in by a specific department (e.g., Marketing Finance) that is frustrated with the slow pace of the central IT team managing Power BI. Its ability to connect to anything and build apps quickly makes it a favourite for agile teams, though its pricing can be complex.
Julius AI & Formula Bot vs. Traditional BI: Neither Julius nor Formula Bot is a replacement for Power BI or Tableau; they are complements. You look at Power BI to see that revenue is down (Monitoring). You use Julius or Formula Bot to ask why or to fix the messy spreadsheet data that feeds the report (Analysis & Prep). Formula Bot specifically excels for the millions of finance professionals who still live in Excel and need a "copilot" to write complex formulas or clean data instantly.
Best Practices for Implementing AI Analytics
It is not enough to know which are the best AI tools for data analytics if you do not know how to use them. Here are 5 practices to help get you started with AI in data analytics:
- Start with a focused use-case: Rather than deploying AI everywhere at once, identify a high-impact, time-consuming analysis task to pilot. For example, pick a recurring finance report or a forecast that takes days to produce. Starting small helps demonstrate quick wins and build confidence.
- Empower and train your team: Involve the end-users (financial analysts, managers) in the process early. Provide training so they trust the tool and know how to ask the right questions. The more people use these tools, the smarter the tools get (in cases like Julius or Power BI’s AI that learn from usage). Fostering a data-driven culture is key – encourage users to explore data daily rather than waiting for IT or analysts.
- Iterate and validate: When you first get an AI insight, validate it against your knowledge or parallel analyses. For example, if an AI tool forecasts a 5% revenue drop next quarter, sanity-check those results with traditional methods or domain expertise. This step is crucial to build trust. Over time, as you see the AI’s accuracy, you can rely on it more. But always keep a human in the loop for critical decisions.
- Integrate into workflows: Make AI insights part of regular decision processes. This could mean scheduling automated reports (so executives receive AI-driven insights by email every Monday), or integrating an AI Q&A tool in meetings (“Let’s ask the analytics assistant for the latest figures”). When AI tools are embedded in day-to-day operations, they deliver continuous value rather than being a one-off novelty.
- Scale gradually: After a successful pilot, broaden the scope. Add more data sources or tackle another use-case (e.g. after automating a monthly performance report, next apply AI to forecast modeling). This phased approach allows learning and adaptation. It also helps in managing change – teams get comfortable with one aspect before adding another.
AI-powered data analytics is no longer a futuristic idea – it’s here now, reshaping how finance teams work. By leveraging some of the best AI tools for data analytics (like the ones we reviewed), organisations can turn overwhelming data into strategic insight. Financial organizations that embrace AI analytics today position themselves to make smarter, quicker decisions tomorrow.
Whether it’s detecting fraud patterns, forecasting market changes, or simply automating your month-end reporting, AI tools can be a game-changer. The key is to choose the right tool for your needs, invest in proper training, and implement with best practices in mind.
Ready to future-proof your finance analytics? Future Savvy is here to help. We offer expert training and consulting to integrate AI analytics tools into your workflow effectively.
Frequently Asked Questions (FAQ)
Prompting, verification, workflow design, automation, and responsible AI use.
No. These skills apply across functions, from admin and marketing to finance and operations.
Clear examples of how you used AI to save time, improve quality, or support better decisions.
Begin with your current tasks, test AI on repeat work, and track the results.
Related Articles
 Tips & Tricks
Design a Cashflow Forecast Template in Excel
A cash-flow forecast template in Excel lets businesses track incoming and outgoing cash, spot shortfalls early, and plan investments confidently. The guide walks you through structuring rows for receipts and payments, columns for time periods, and using SUM-based formulas to automate totals and month-end balances.
 Tips & Tricks
25 Most Popular Excel Formulas & Functions
Mastering Excel formulas and functions boosts efficiency, accuracy, and workflow, so the article offers a downloadable PDF of 25 essential formulas - ranging from SUM and IF to VLOOKUP and XLOOKUP - each with syntax and practical use cases. The article also spotlights five must-know Excel visualizations (heat maps, box plots, Pareto charts, histograms, and scatter plots) and compares Excel’s hands-on data control with Power BI’s cloud-hosted, interactive dashboards for large datasets.
 Tips & Tricks
From Zero to Hero: Practical Ways to Boost Productivity with Copilot in Excel
Microsoft Copilot for Excel, a generative-AI assistant built into Microsoft 365, turns natural-language prompts into instant formulas, pivots, charts, and summaries - eliminating much of Excel’s manual grunt work. After enabling Copilot in a cloud-saved workbook, users simply describe tasks like highlighting duplicates, cleaning data, generating complex formulas, or visualising trends, and Copilot does the heavy lifting while explaining its logic. The article also offers step-by-step setup guidance and a list of ready-made prompts to help users go from “zero to hero” in productivity.
